


हमारी टीम के पास 7,000,000 से अधिक ट्रेडर हैं!
प्रतिदिन हम ट्रेडिंग को बेहतर बनाने के लिए एक साथ काम करते हैं। हम उच्च परिणाम प्राप्त कर रहे हैं और आगे की ओर बढ़ रहे हैं।
दुनियाभर के लाखों लोगों द्वारा हमारे काम को पहचानना, हमारे काम की सबसे अच्छी सराहना है! आपने आपनी पसंद बनाई है और हम आपकी अपेक्षाओं को पूरा करने के लिए हर संभव प्रयास करेंगे!
हम एक साथ एक अच्छी टीम हैं!
इंस्टाफॉरेक्स को इस बात का गर्व है कि वह आपके लिए काम कर रहा है!


एक्टर, यूएफसी 6 टूर्नामेंट का विजेता और एक सच्चा हीरो!
वह आदमी, जिसने अपनी मेहनत से सब किया है। वह आदमी, जो हमारे रास्तों पर चलता है.
टैक्टारोव की सफलता का राज लक्ष्य की ओर लगातर अग्रसर रहना है।
अपनी प्रतिभा के सभी पक्षों को प्रकट करें!
खोज करें, कोशिश करें, विफल हो-लेकिन कभी न रूकें!
इंस्टाफॉरेक्स- हमारी सफलताओं की कहानी यहाँ से शुरू होती है!

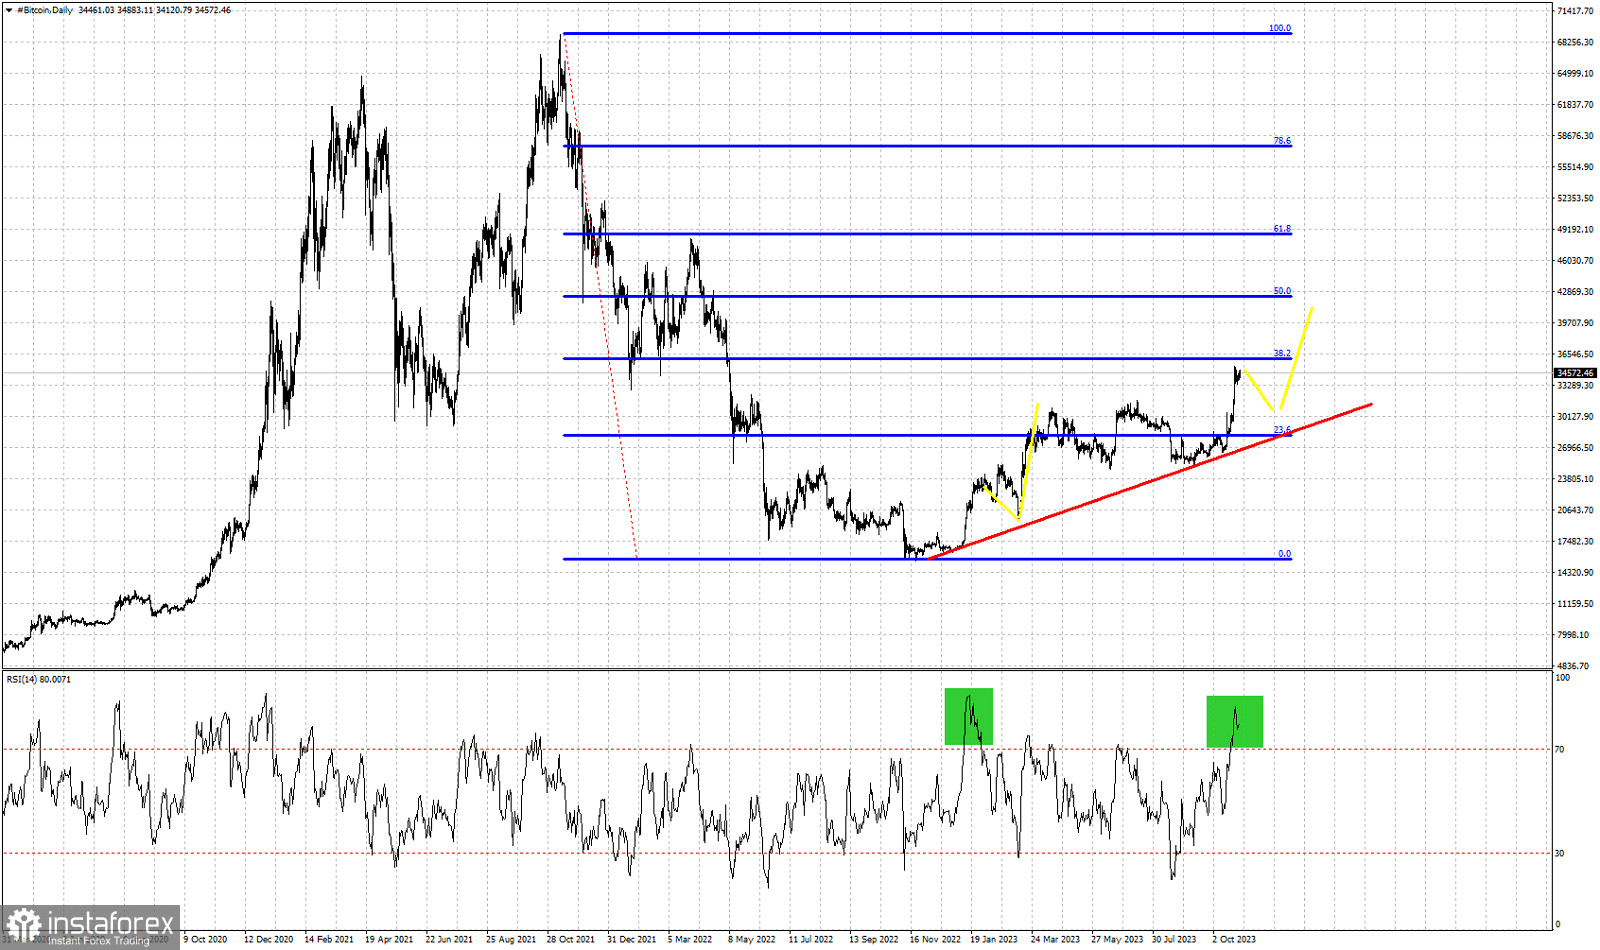
Blue lines- Fibonacci retracement levels
Red line- support trend line
Yellow lines- expected path
green rectangles- overbought spikes in the RSI
Bitcoin is trading around $34,680 just below the 38% Fibonacci retracement of the entire decline from its all time highs. Bitcoin has started making higher highs and higher lows over the last nine months. The RSI is approaching similar overbought levels to the bullish wave that occurred back in January. A pull back followed that provided us with a lower high and another leg higher followed to new higher highs. If the pattern repeats itself, Bitcoin could make a pull back towards $30,000-$31,000 and the red support trend line. A new higher low should form there around these levels and a new wave to the upside should follow. Concluding it is important for bulls to defend the red upward sloping trend line. As long as we trade above it, bulls have the upper hand. In the near term a pull back is justified as the RSI has reached deep inside the overbought area.
*यहां पर लिखा गया बाजार विश्लेषण आपकी जागरूकता बढ़ाने के लिए किया है, लेकिन व्यापार करने के लिए निर्देश देने के लिए नहीं |
InstaSpot analytical reviews will make you fully aware of market trends! Being an InstaSpot client, you are provided with a large number of free services for efficient trading.


