


Legenda dalam pasukan InstaSpot!
Legenda! Anda fikir ia adalah satu retorik yang besar? Tetapi bagaimana untuk kita memanggil seorang lelaki, yang telah menjadi pemain Asia pertama yang memenangi kejohanan catur dunia junior pada usia 18 tahun dan menjadi Grandmaster India pertama pada usia 19 tahun? Itulah permulaan yang sukar untuk merangkul gelaran Juara Dunia untuk Viswanathan Anand, seorang juara yang telah menjadi sebahagian daripada sejarah catur. Kini satu lagi legenda dalam pasukan InstaSpot!


Borussia adalah salah satu kelab bola sepak paling terkemuka di Jerman, yang telah berulang kali membuktikan kepada peminatnya: semangat persaingan dan kepemimpinan pasti akan membawa kepada kejayaan. Berdagang dengan cara yang sama seperti atlet sukan profesional beraksi menentang lawan: yakin dan aktif. Simpan "hantaran" dari Borussia FC dan menjadi pedagang hebat dengan InstaSpot!

UK inflation data disappointed investors. The growth rate of consumer prices slowed down from 10.4% to 10.1%, which is worse than the forecast of 9.8%. This data may push the Bank of England to continue the cycle of tightening monetary policy.
In Europe, the final inflation data matched the preliminary estimate, which indicated a slowdown in the pace of growth from 8.5% to 6.9%. Since the data was already priced in, there was no reaction in the market at the time of publication.
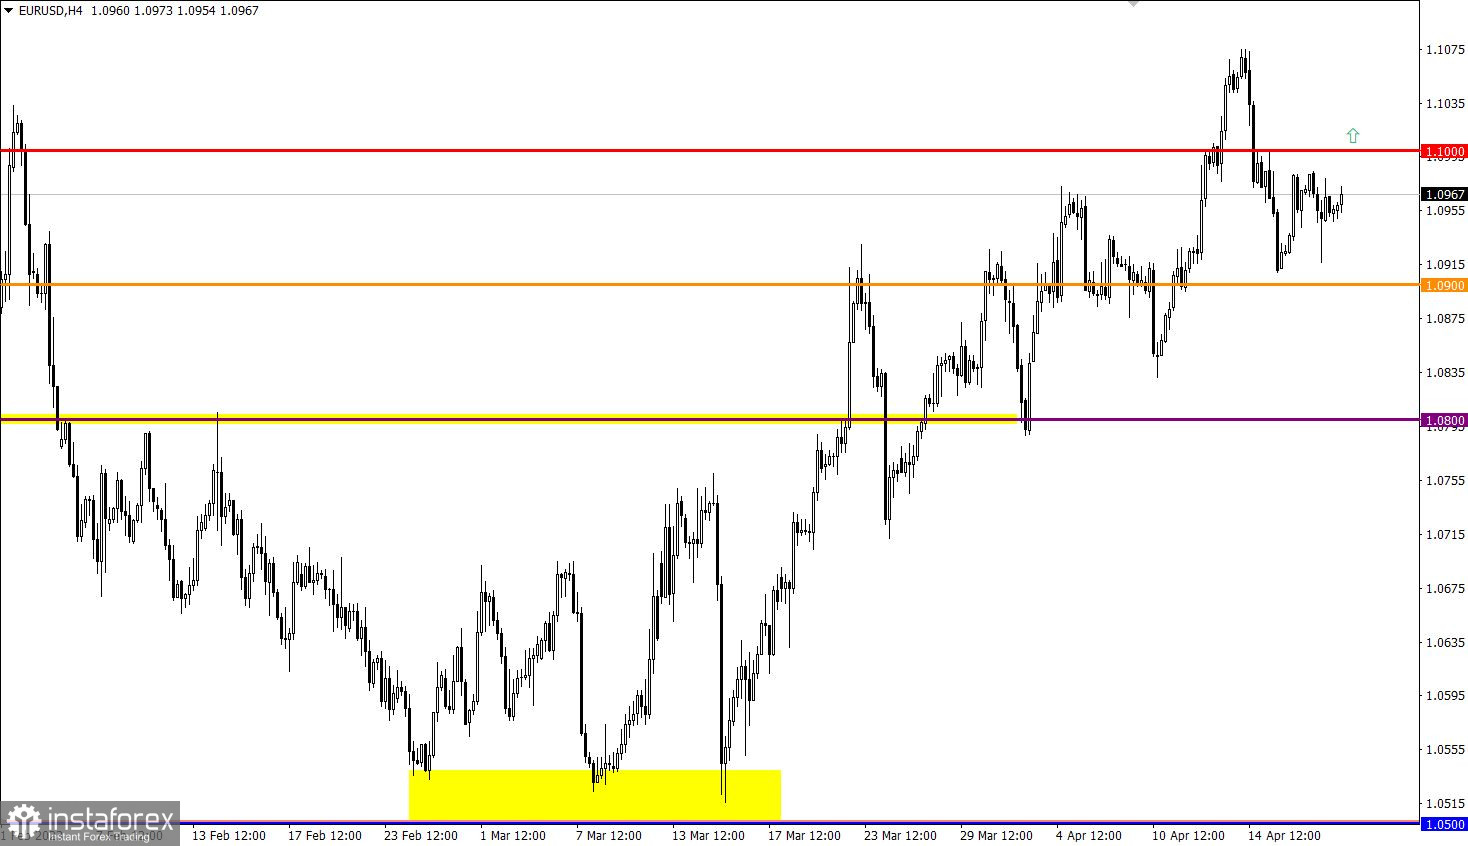
Despite the recent attempt to restore the EUR/USD exchange rate relative to the recent decline, the quote is still below the 1.1000 level. This movement indicates a slowdown in the upward trend but not its completion.
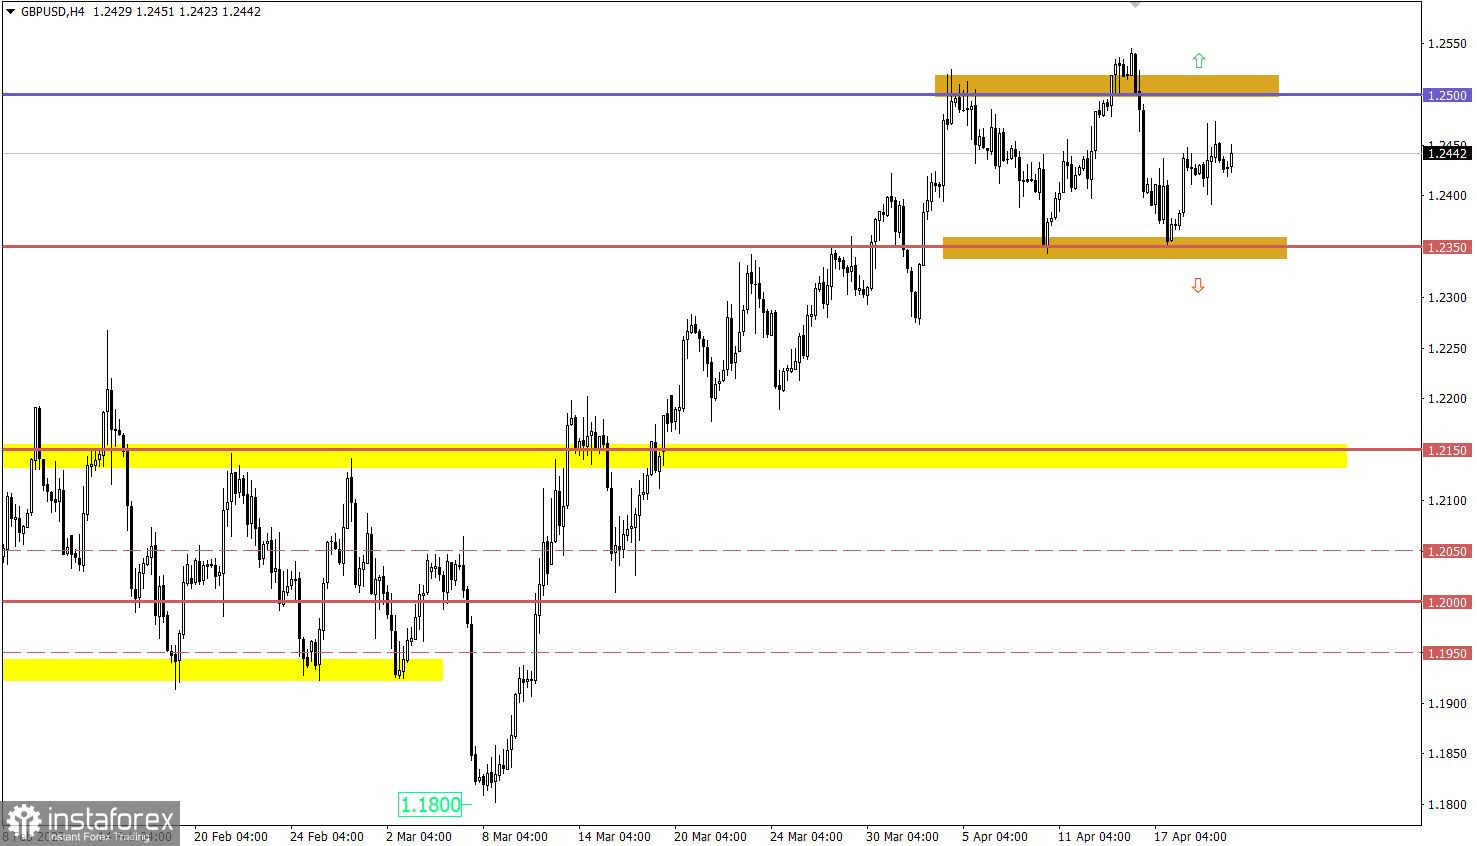
GBP/USD is in the stage of short-term stagnation, which is within the framework of a two-week sideways amplitude of 1.2350/1.2550.
During the American trading session, applications for unemployment benefits in the United States will be published, where an increase in their overall indicator is forecasted. Details of statistical data indicate that the volume of continuing claims for benefits may rise from 1.810 million to 1.820 million, and the volume of initial claims for benefits may rise from 239,000 to 240,000.
The increase in the number of applications for benefits is a negative factor for the labor market.
Time targeting:
U.S. Jobless Claims – 12:30 UTC
In the current situation, traders continue to consider two possible scenarios in their work: the first, a possible price rebound from the 1.1000 level with the intensification of the corrective movement, and the second, holding the price above the 1.1000 level with the possibility of updating the local high in the medium-term trend.
The stagnation at the 1.2430 level will soon end in this situation. From a technical analysis perspective, the current pause can be defined as a process of accumulating trading forces, which can lead to the emergence of an outgoing impulse. However, the main range of price changes is within 1.2350/1.2550. Therefore, the end of the short-term stagnation may lead to quotes approaching one of the main range borders, depending on the direction of the outgoing impulse.
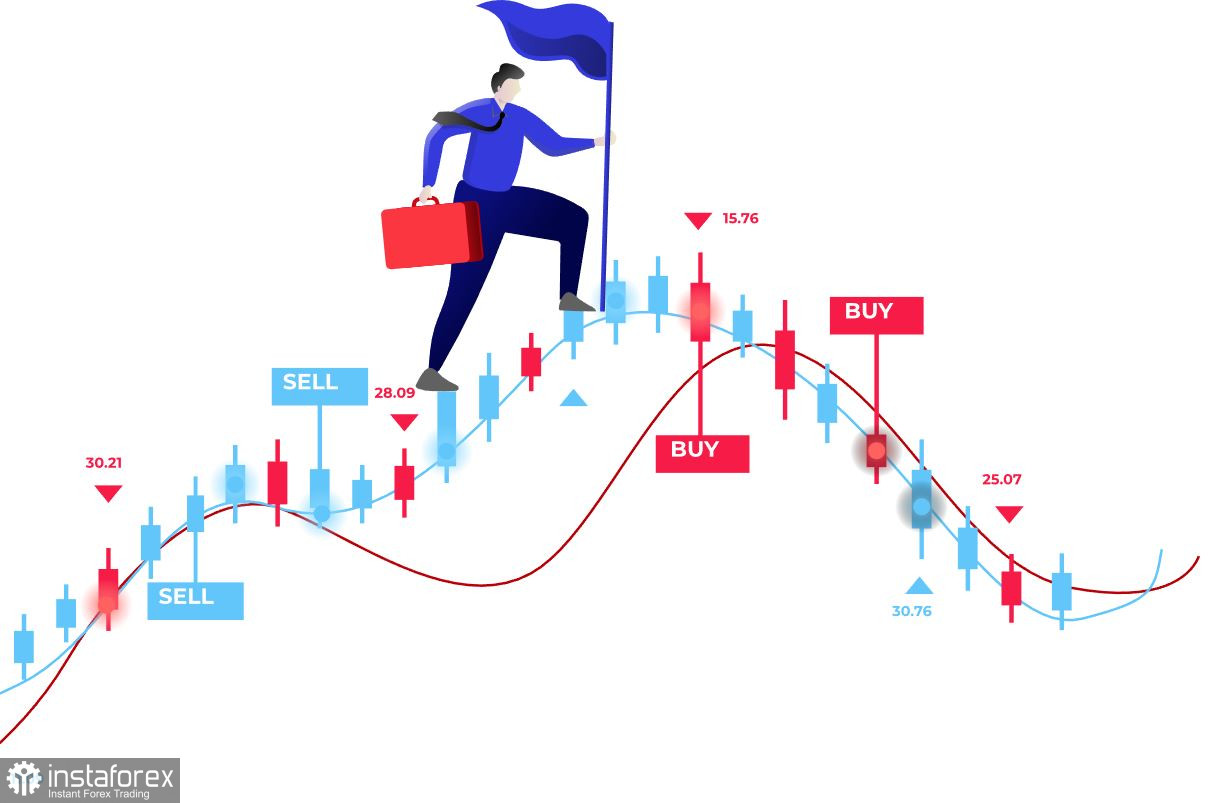
The candlestick chart type is white and black graphic rectangles with lines above and below. With a detailed analysis of each individual candle, you can see its characteristics relative to a particular time frame: opening price, closing price, intraday high and low.
Horizontal levels are price coordinates, relative to which a price may stop or reverse its trajectory. In the market, these levels are called support and resistance.
Circles and rectangles are highlighted examples where the price reversed in history. This color highlighting indicates horizontal lines that may put pressure on the asset's price in the future.
The up/down arrows are landmarks of the possible price direction in the future.
* Analisis pasaran yang disiarkan di sini adalah bertujuan untuk meningkatkan kesedaran anda, tetapi tidak untuk memberi arahan untuk membuat perdagangan.
Kajian analisis InstaSpot akan membuat anda mengetahui sepenuhnya aliran pasaran! Sebagai pelanggan InstaSpot, anda disediakan sejumlah besar perkhidmatan percuma untuk dagangan yang cekap.


