


Il y a maintenant plus de 7 millions de traders dans notre équipe! Chaque jour nous travaillons à améliorer le trading. On s'efforce de vous offrir le meilleur et on obtient les plus beaux succès.
La confiance de millions de traders partout dans le monde est l'évaluation la plus élevée de notre travail!
Vous avez fait votre choix et nous allons faire de notre mieux pour répondre à vos attentes!
Ensemble, nous faisons une super équipe!
InstaSpot est fier de vous servir!


L'acteur, le champion de l'UFC et un vrai bogatyr russe! . Homme qui ne doit sa réussite qu'à lui-même. L'homme qui est sur la même route que nous suivons.
Le secret du succès de Taktarov est le progrès permanent vers la réalisation de son objectif.
Découvrez toutes les facettes de votre talent! Apprenez, essayez, commettez des erreurs, mais ne vous arrêtez pas!
InstaSpot - L'histoire de votre succès commence ici !
UK inflation data disappointed investors. The growth rate of consumer prices slowed down from 10.4% to 10.1%, which is worse than the forecast of 9.8%. This data may push the Bank of England to continue the cycle of tightening monetary policy.
In Europe, the final inflation data matched the preliminary estimate, which indicated a slowdown in the pace of growth from 8.5% to 6.9%. Since the data was already priced in, there was no reaction in the market at the time of publication.
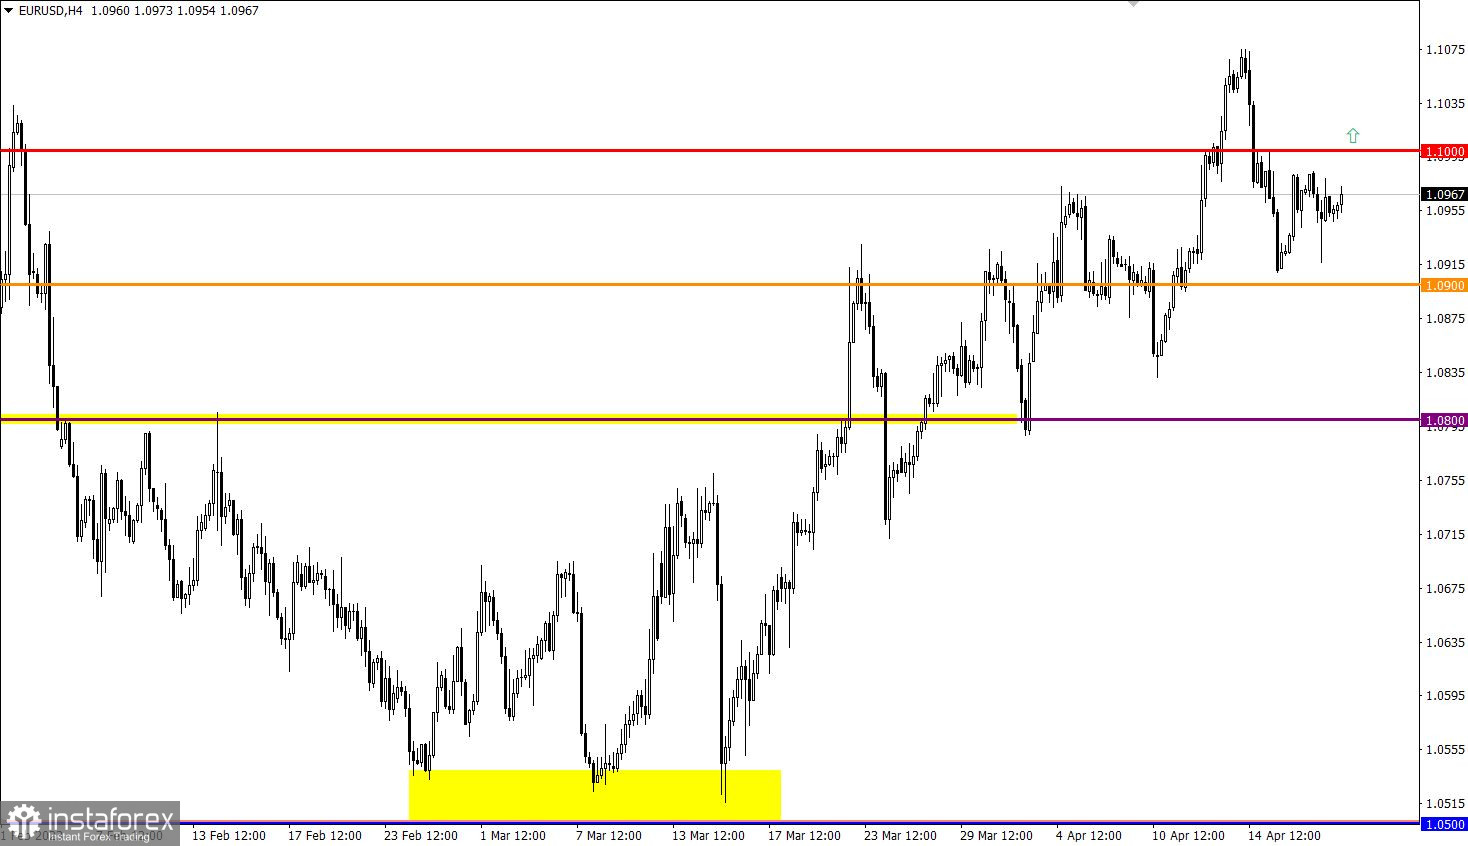
Despite the recent attempt to restore the EUR/USD exchange rate relative to the recent decline, the quote is still below the 1.1000 level. This movement indicates a slowdown in the upward trend but not its completion.
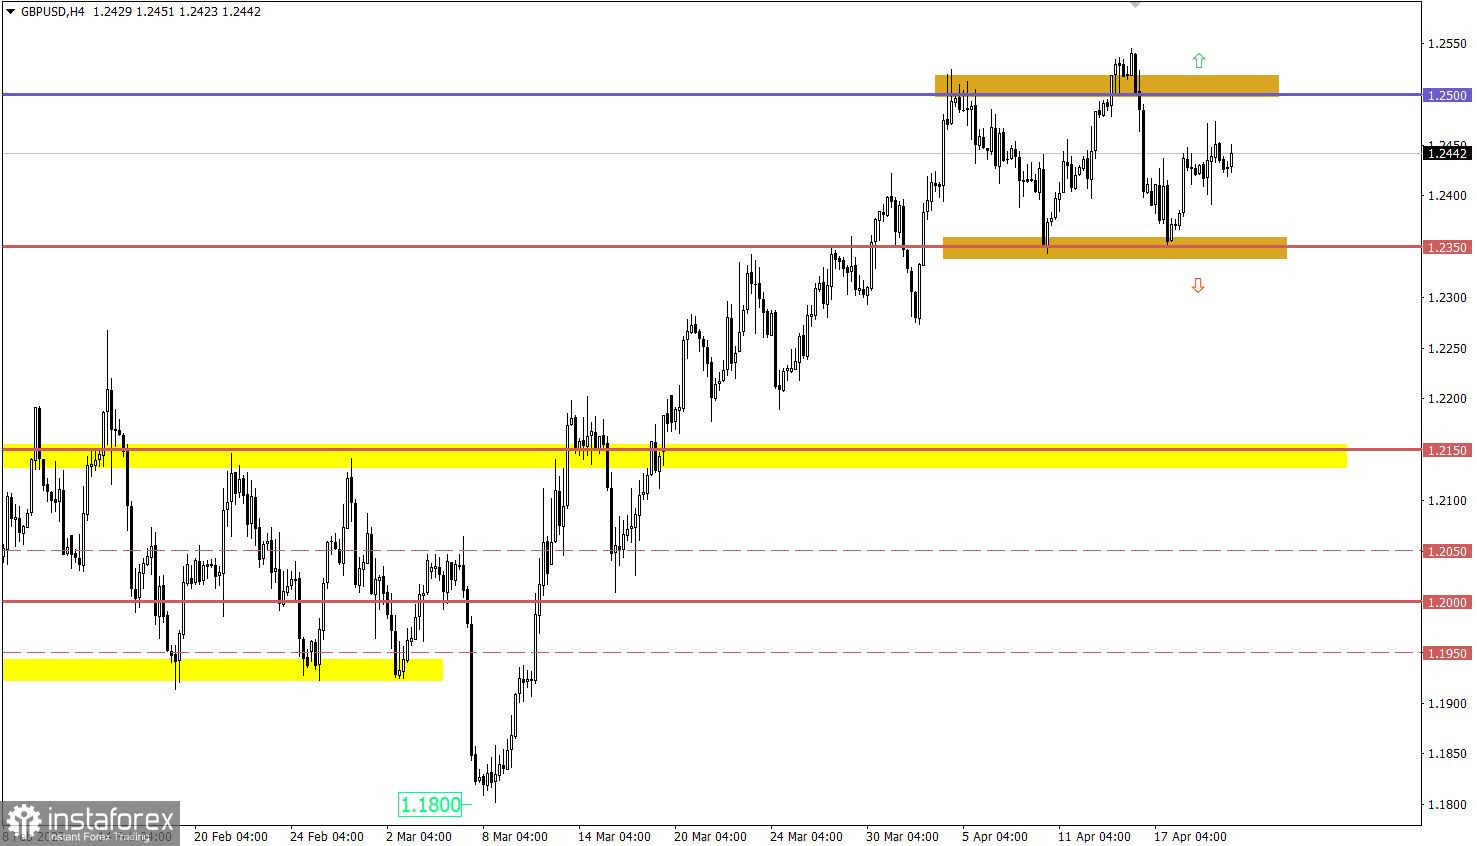
GBP/USD is in the stage of short-term stagnation, which is within the framework of a two-week sideways amplitude of 1.2350/1.2550.
During the American trading session, applications for unemployment benefits in the United States will be published, where an increase in their overall indicator is forecasted. Details of statistical data indicate that the volume of continuing claims for benefits may rise from 1.810 million to 1.820 million, and the volume of initial claims for benefits may rise from 239,000 to 240,000.
The increase in the number of applications for benefits is a negative factor for the labor market.
Time targeting:
U.S. Jobless Claims – 12:30 UTC
In the current situation, traders continue to consider two possible scenarios in their work: the first, a possible price rebound from the 1.1000 level with the intensification of the corrective movement, and the second, holding the price above the 1.1000 level with the possibility of updating the local high in the medium-term trend.
The stagnation at the 1.2430 level will soon end in this situation. From a technical analysis perspective, the current pause can be defined as a process of accumulating trading forces, which can lead to the emergence of an outgoing impulse. However, the main range of price changes is within 1.2350/1.2550. Therefore, the end of the short-term stagnation may lead to quotes approaching one of the main range borders, depending on the direction of the outgoing impulse.
The candlestick chart type is white and black graphic rectangles with lines above and below. With a detailed analysis of each individual candle, you can see its characteristics relative to a particular time frame: opening price, closing price, intraday high and low.
Horizontal levels are price coordinates, relative to which a price may stop or reverse its trajectory. In the market, these levels are called support and resistance.
Circles and rectangles are highlighted examples where the price reversed in history. This color highlighting indicates horizontal lines that may put pressure on the asset's price in the future.
The up/down arrows are landmarks of the possible price direction in the future.
*The market analysis posted here is meant to increase your awareness, but not to give instructions to make a trade.
InstaSpot analytical reviews will make you fully aware of market trends! Being an InstaSpot client, you are provided with a large number of free services for efficient trading.


