


Kumpulan kami mempunyai lebih daripada 7,000,000 pedagang!
Setiap hari kami bekerjasama untuk meningkatkan perdagangan. Kami mendapat keputusan yang tinggi dan bergerak ke hadapan.
Pengiktirafan oleh berjuta-juta pedagang di seluruh dunia adalah penghargaan terbaik untuk kerja kami! Anda membuat pilihan anda dan kami akan melakukan segalanya yang diperlukan untuk memenuhi jangkaan anda!
Kami adalah kumpulan yang terbaik bersama!
InstaSpot. Berbangga bekerja untuk anda!


Pelakon, juara kejohanan UFC 6 dan seorang wira sebenar!
Lelaki yang membuat dirinya sendiri. Lelaki yang mengikut cara kami.
Rahsia di sebalik kejayaan Taktarov adalah pergerakan berterusan ke arah matlamat.
Dedahkan semua segi bakat anda!
Cari, cuba, gagal - tetapi tidak pernah berhenti!
InstaSpot. Kisah kejayaan anda bermula di sini!

EUR/USD

Higher time frames
The pair closed February's session with a strong bearish candlestick. In February, bears developed a pullback from the resistance area formed by a combination of the monthly medium-term trend and the upper boundary of the weekly Ichimoku Cloud. In March, the main goal for the sellers will be to confirm and develop the previously formed pullback. At the moment, the area of 1.0579 –1.0576 (monthly Fibo Kijun + lower line of the daily Ichimoku Cloud) acts as resistance. A break from the daily Ichimoku Cloud to the selling zone and a firm hold in this area will set a new downward target for the next breakout. The weekly support area at 1.0461 –1.0363 –1.0284 fortified by the monthly short-term trend at 1.0284 will serve as the next downward targets. In case bulls seize the initiative, they will need to cancel the Death Cross with the levels at 1.0619 –1.0724 –1.0783 –1.0842. Next, buyers will have to enter the bullish zone at 1.0777 and form support at the weekly short-term trend of 1.0758. Besides, another goal for the bulls will be to overcome the resistance area at 1.0894 –1.0901 where the levels of the monthly short-term trend and the upper line of the weekly Ichimoku Cloud have converged.
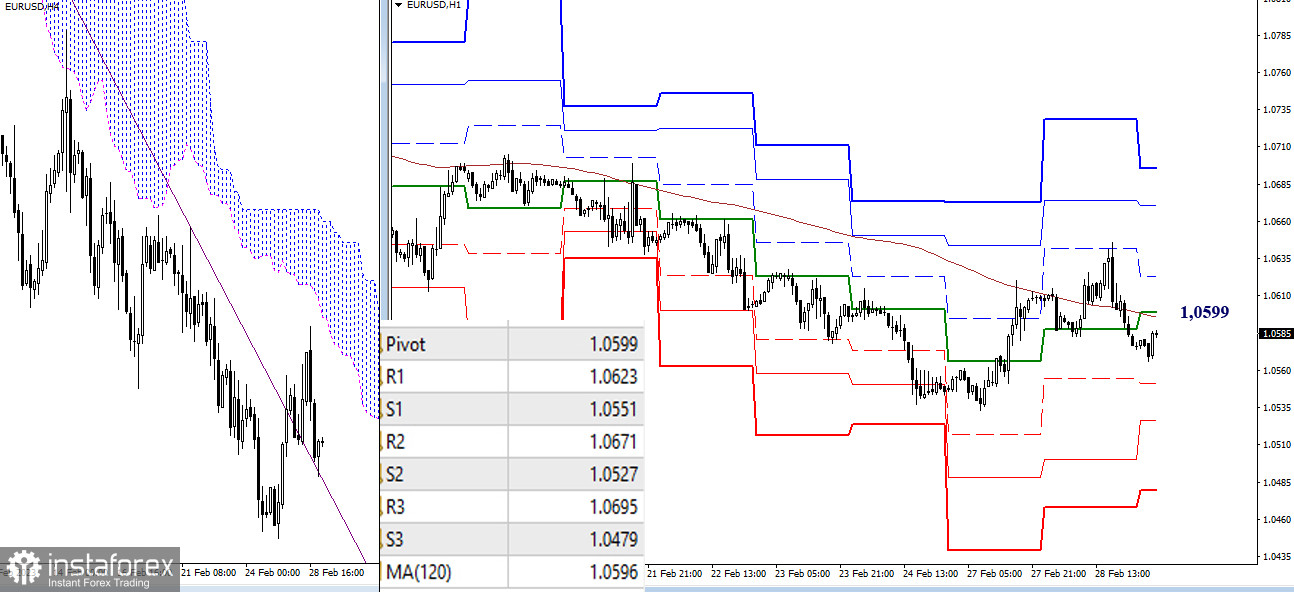
H4 – H1
On lower time frames, the pair is still looking for direction for the long term. That is why the key levels are constantly shifted. Trading above the key levels of 1.0596-99 (daily central pivot level + weekly long-term trend) will mean that bulls are leading the market. Their upward targets are located at the resistance area formed by the standard pivot levels of 1.0623 –1.0671–1.0695. Trading below the key levels of 1.0596-99 will intensify the bearish bias. In this case, the downward targets are found at the key support levels of 1.0551–1.0527–1.0479.
***
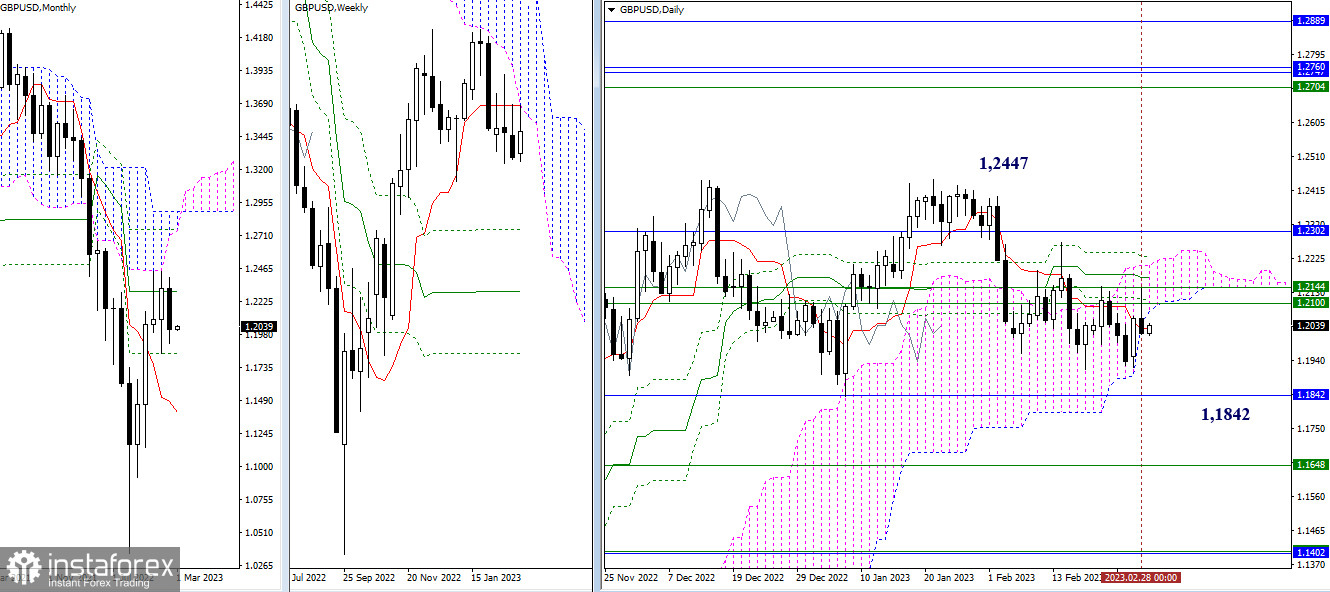
GBP/USD
Higher time frames
The pound/dollar pair stayed within the range of the candlestick formed in January. This led to uncertainty on the monthly time frame which resulted in consolidation. Bears will need to move beyond the monthly Fibo Kijun level of 1.1842 and test the next support level represented, for example, by the levels of the weekly Ichimoku Cross (1.1648 –1.1401) and the monthly short-term trend (1.1401). The main goal for the bulls today is to pass the accumulation of resistance levels of 1.2100 –1.2144 –1.2232 –1.2302 found on different time frames and break above the monthly candlestick of 1.2447 that was formed in January.
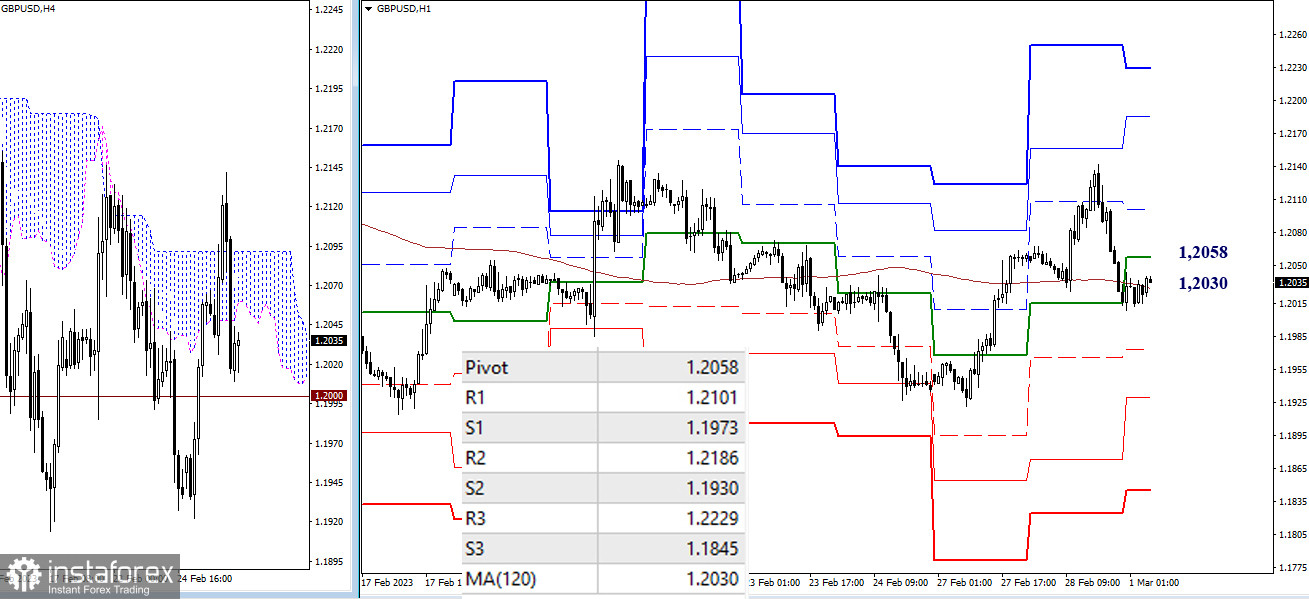
H4 – H1
At the moment, the pair is trading near the key levels of 1.2030 –1.2058 (daily central pivot level + weekly long-term trend). Consolidation near these key levels shows that none of the forces is in control of the market. Gaining control of the key levels and trading below them will intensify the bearish bias. If so, the main downward targets for the day are located at the support area formed by the standard pivot levels of 1.1973 –1.1930 –1.1845. Consolidation and trading above the key levels of 1.2030–1.2058 will mark the prevalence of the bulls. In this case, the upward targets are seen at the standard pivot levels of 1.2101–1.2186–1.2229.
***
Technical analysis is based on:
Higher time frames – Ichimoku Kinko Hyo (9.26.52) + Fibo Kijun levels
Lower time frames – H1: Pivot Points (standard) + 120-day Moving Average (weekly long-term trend)
* Analisis pasaran yang disiarkan di sini adalah bertujuan untuk meningkatkan kesedaran anda, tetapi tidak untuk memberi arahan untuk membuat perdagangan.
Kajian analisis InstaSpot akan membuat anda mengetahui sepenuhnya aliran pasaran! Sebagai pelanggan InstaSpot, anda disediakan sejumlah besar perkhidmatan percuma untuk dagangan yang cekap.


