


Huyền thoại trong nhóm InstaSpot!
Huyền thoại! Bạn nghĩ rằng đó là lời nói khoa trương? Nhưng chúng ta nên gọi một người đàn ông như thế nào, người đã trở thành người châu Á đầu tiên giành chức vô địch cờ vua thế giới lứa tuổi thiếu niên năm 18 tuổi và người trở thành Đại kiện tướng Ấn Độ đầu tiên năm 19 tuổi? Đó là khởi đầu cho con đường khó khăn đến danh hiệu Vô địch Thế giới của Viswanathan Anand, người đàn ông đã trở thành một phần của lịch sử cờ vua mãi mãi. Giờ đây, một huyền thoại nữa trong nhóm InstaSpot!


Borussia là một trong những câu lạc bộ bóng đá danh giá nhất nước Đức, đã nhiều lần chứng minh cho người hâm mộ thấy: tinh thần thi đấu và sự lãnh đạo chắc chắn sẽ dẫn đến thành công. Giao dịch theo cách mà các chuyên gia thể thao chơi trò chơi: tự tin và chủ động. Giữ một "đường chuyền" từ Borussia FC và dẫn đầu với InstaSpot!
EUR/USD

Higher time frames
The pair closed February's session with a strong bearish candlestick. In February, bears developed a pullback from the resistance area formed by a combination of the monthly medium-term trend and the upper boundary of the weekly Ichimoku Cloud. In March, the main goal for the sellers will be to confirm and develop the previously formed pullback. At the moment, the area of 1.0579 –1.0576 (monthly Fibo Kijun + lower line of the daily Ichimoku Cloud) acts as resistance. A break from the daily Ichimoku Cloud to the selling zone and a firm hold in this area will set a new downward target for the next breakout. The weekly support area at 1.0461 –1.0363 –1.0284 fortified by the monthly short-term trend at 1.0284 will serve as the next downward targets. In case bulls seize the initiative, they will need to cancel the Death Cross with the levels at 1.0619 –1.0724 –1.0783 –1.0842. Next, buyers will have to enter the bullish zone at 1.0777 and form support at the weekly short-term trend of 1.0758. Besides, another goal for the bulls will be to overcome the resistance area at 1.0894 –1.0901 where the levels of the monthly short-term trend and the upper line of the weekly Ichimoku Cloud have converged.
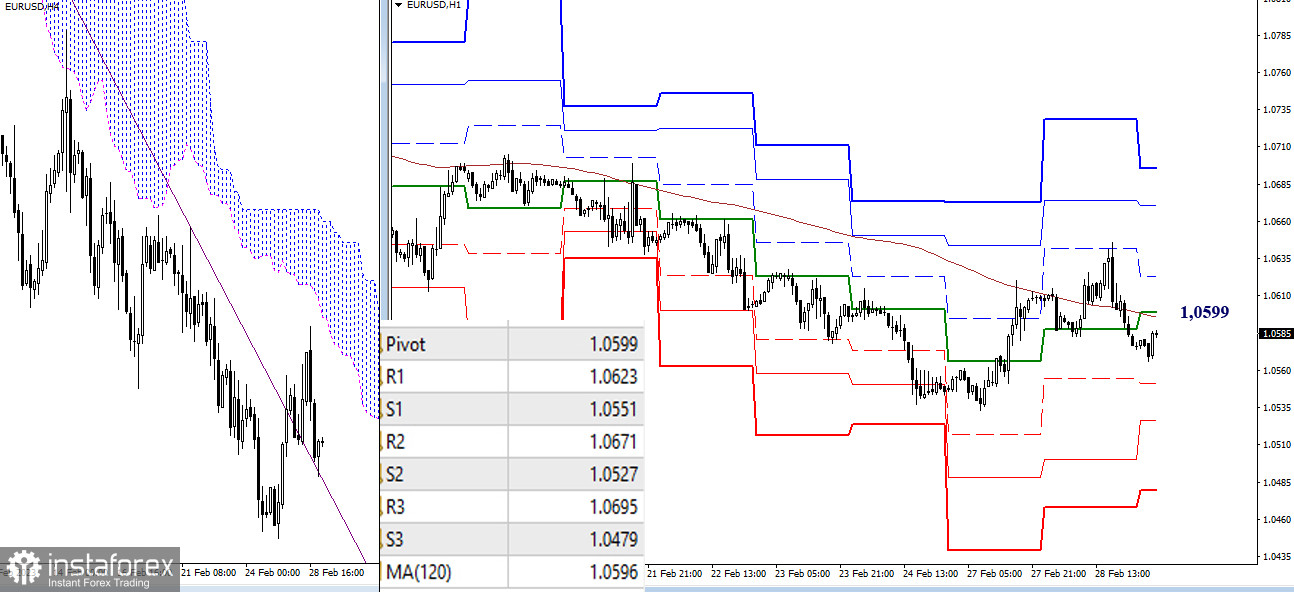
H4 – H1
On lower time frames, the pair is still looking for direction for the long term. That is why the key levels are constantly shifted. Trading above the key levels of 1.0596-99 (daily central pivot level + weekly long-term trend) will mean that bulls are leading the market. Their upward targets are located at the resistance area formed by the standard pivot levels of 1.0623 –1.0671–1.0695. Trading below the key levels of 1.0596-99 will intensify the bearish bias. In this case, the downward targets are found at the key support levels of 1.0551–1.0527–1.0479.
***
GBP/USD
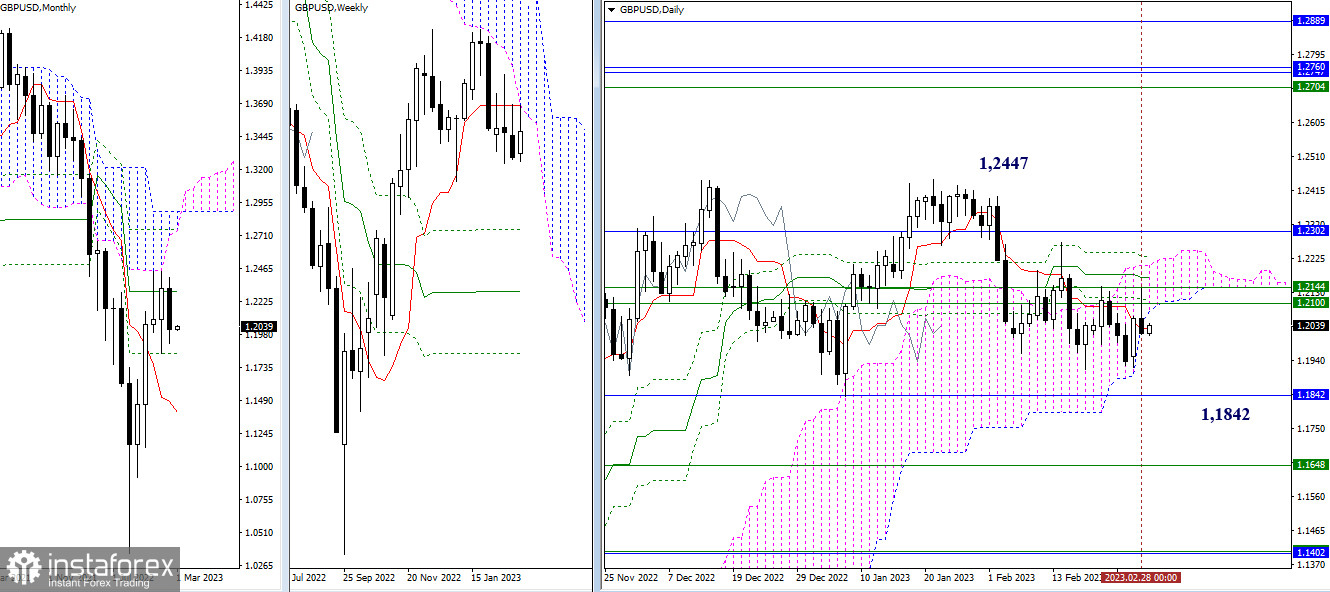
Higher time frames
The pound/dollar pair stayed within the range of the candlestick formed in January. This led to uncertainty on the monthly time frame which resulted in consolidation. Bears will need to move beyond the monthly Fibo Kijun level of 1.1842 and test the next support level represented, for example, by the levels of the weekly Ichimoku Cross (1.1648 –1.1401) and the monthly short-term trend (1.1401). The main goal for the bulls today is to pass the accumulation of resistance levels of 1.2100 –1.2144 –1.2232 –1.2302 found on different time frames and break above the monthly candlestick of 1.2447 that was formed in January.
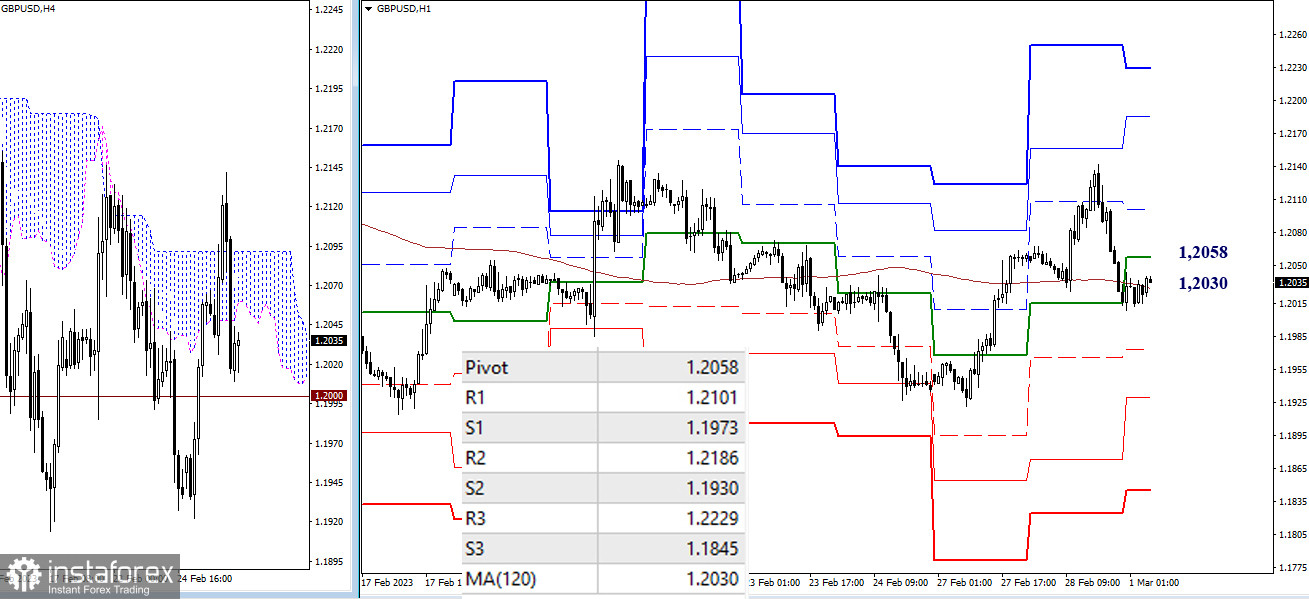
H4 – H1
At the moment, the pair is trading near the key levels of 1.2030 –1.2058 (daily central pivot level + weekly long-term trend). Consolidation near these key levels shows that none of the forces is in control of the market. Gaining control of the key levels and trading below them will intensify the bearish bias. If so, the main downward targets for the day are located at the support area formed by the standard pivot levels of 1.1973 –1.1930 –1.1845. Consolidation and trading above the key levels of 1.2030–1.2058 will mark the prevalence of the bulls. In this case, the upward targets are seen at the standard pivot levels of 1.2101–1.2186–1.2229.
***
Technical analysis is based on:
Higher time frames – Ichimoku Kinko Hyo (9.26.52) + Fibo Kijun levels
Lower time frames – H1: Pivot Points (standard) + 120-day Moving Average (weekly long-term trend)
*Phân tích thị trường được đăng tải ở đây có nghĩa là để gia tăng nhận thức của bạn, nhưng không đưa ra các chỉ dẫn để thực hiện một giao dịch.
InstaSpot analytical reviews will make you fully aware of market trends! Being an InstaSpot client, you are provided with a large number of free services for efficient trading.


