


Kumpulan kami mempunyai lebih daripada 7,000,000 pedagang!
Setiap hari kami bekerjasama untuk meningkatkan perdagangan. Kami mendapat keputusan yang tinggi dan bergerak ke hadapan.
Pengiktirafan oleh berjuta-juta pedagang di seluruh dunia adalah penghargaan terbaik untuk kerja kami! Anda membuat pilihan anda dan kami akan melakukan segalanya yang diperlukan untuk memenuhi jangkaan anda!
Kami adalah kumpulan yang terbaik bersama!
InstaSpot. Berbangga bekerja untuk anda!


Pelakon, juara kejohanan UFC 6 dan seorang wira sebenar!
Lelaki yang membuat dirinya sendiri. Lelaki yang mengikut cara kami.
Rahsia di sebalik kejayaan Taktarov adalah pergerakan berterusan ke arah matlamat.
Dedahkan semua segi bakat anda!
Cari, cuba, gagal - tetapi tidak pernah berhenti!
InstaSpot. Kisah kejayaan anda bermula di sini!

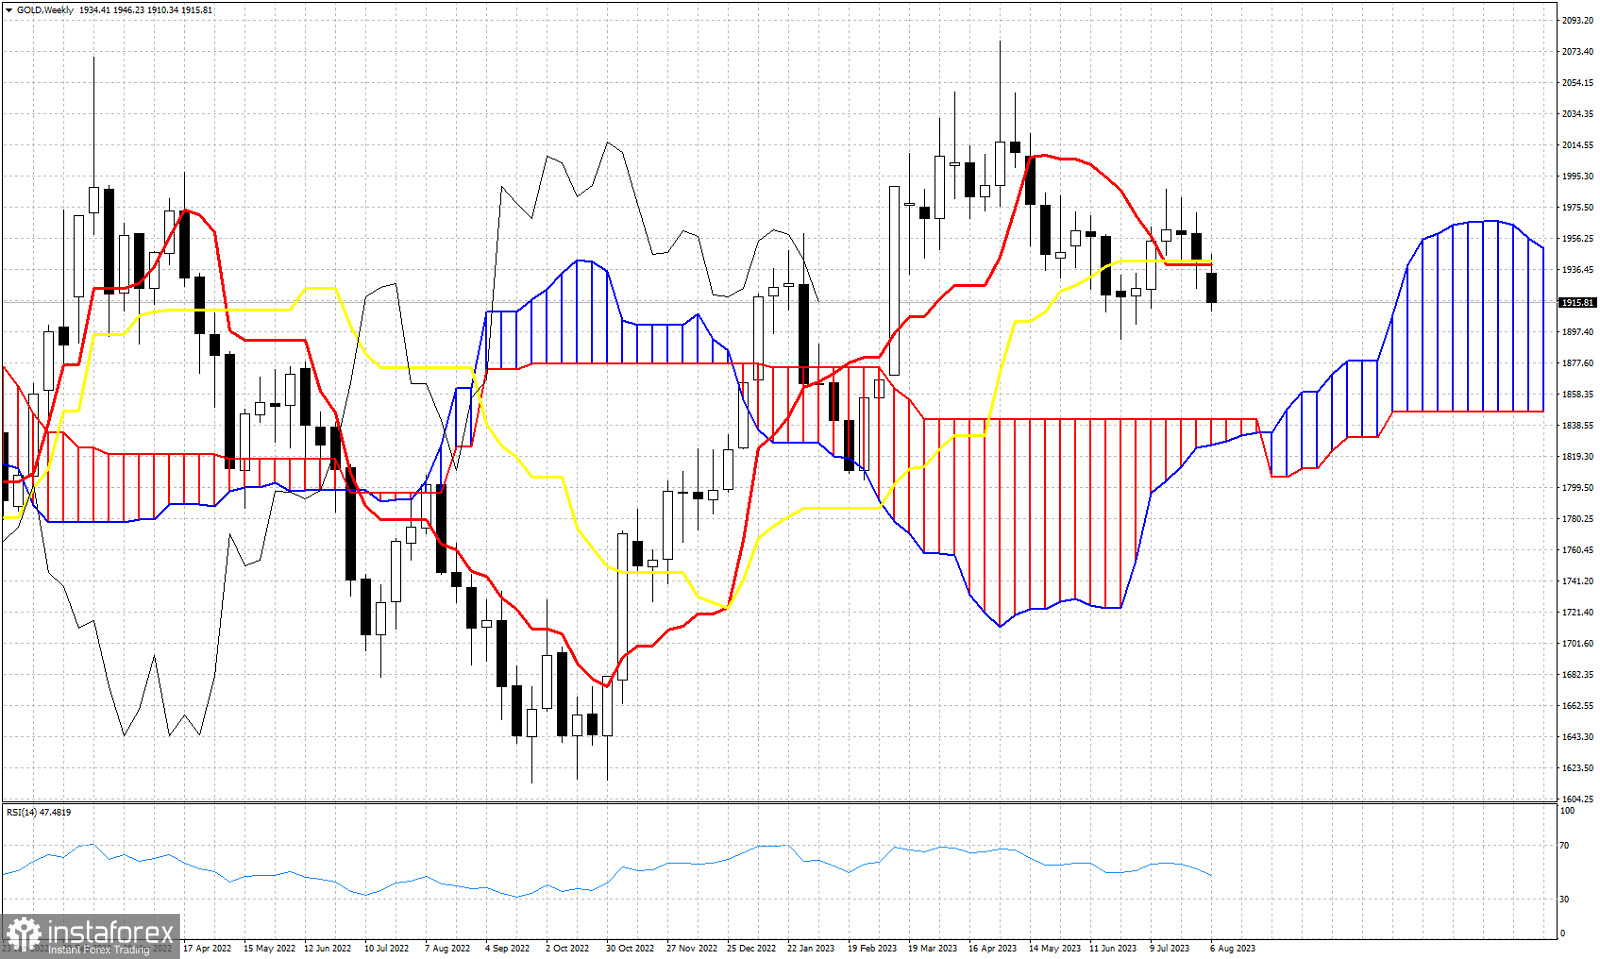
The weekly candlestick in Gold is providing a bearish warning. Price this week is trading below the tenkan-sen (red line indicator) and the kijun-sen (yellow line indicator). Both these two indicators provide resistance at $1,940. A weekly close below this level suggests that price remains vulnerable to a move towards the weekly Kumo (cloud) at $1,842. The Chikou span (black line indicator) remains above the candlestick pattern (bullish), but has a negative slope making lower lows and lower highs. Although price remains above the Kumo (bullish), having broken below the kijun-sen suggests that price is vulnerable. The tenkan-sen has also crossed below the kijun-sen providing an added sign of weakness. The weekly chart using the Ichimoku cloud indicator suggests that Gold price has more chances of falling than starting a new up trend.
* Analisis pasaran yang disiarkan di sini adalah bertujuan untuk meningkatkan kesedaran anda, tetapi tidak untuk memberi arahan untuk membuat perdagangan.
Kajian analisis InstaSpot akan membuat anda mengetahui sepenuhnya aliran pasaran! Sebagai pelanggan InstaSpot, anda disediakan sejumlah besar perkhidmatan percuma untuk dagangan yang cekap.


