


The legend in the InstaSpot team!
Legend! You think that's bombastic rhetoric? But how should we call a man, who became the first Asian to win the junior world chess championship at 18 and who became the first Indian Grandmaster at 19? That was the start of a hard path to the World Champion title for Viswanathan Anand, the man who became a part of history of chess forever. Now one more legend in the InstaSpot team!


Borussia is one of the most titled football clubs in Germany, which has repeatedly proved to fans: the spirit of competition and leadership will certainly lead to success. Trade in the same way that sports professionals play the game: confidently and actively. Keep a "pass" from Borussia FC and be in the lead with InstaSpot!

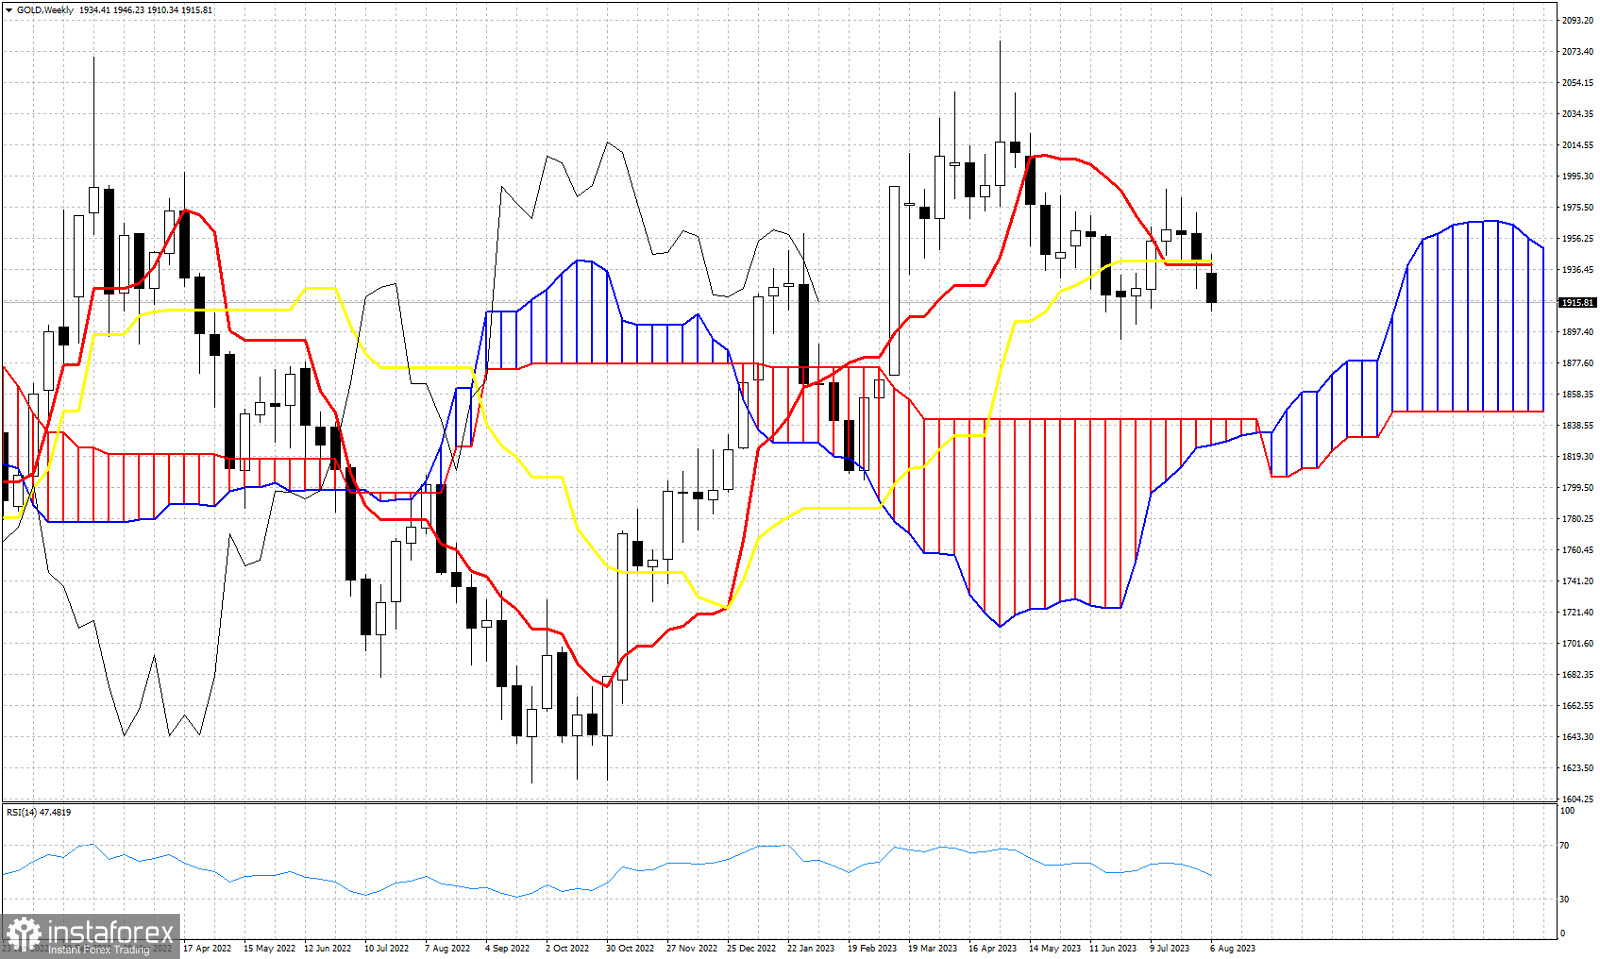
The weekly candlestick in Gold is providing a bearish warning. Price this week is trading below the tenkan-sen (red line indicator) and the kijun-sen (yellow line indicator). Both these two indicators provide resistance at $1,940. A weekly close below this level suggests that price remains vulnerable to a move towards the weekly Kumo (cloud) at $1,842. The Chikou span (black line indicator) remains above the candlestick pattern (bullish), but has a negative slope making lower lows and lower highs. Although price remains above the Kumo (bullish), having broken below the kijun-sen suggests that price is vulnerable. The tenkan-sen has also crossed below the kijun-sen providing an added sign of weakness. The weekly chart using the Ichimoku cloud indicator suggests that Gold price has more chances of falling than starting a new up trend.
*এখানে পোস্ট করা মার্কেট বিশ্লেষণ আপনার সচেতনতা বৃদ্ধির জন্য প্রদান করা হয়, ট্রেড করার নির্দেশনা প্রদানের জন্য প্রদান করা হয় না।
ইন্সটাফরেক্স বিশ্লেষণমূলক পর্যালোচনাগুলো আপনাকে মার্কেট প্রবণতা সম্পর্কে পুরোপুরি সচেতন করবে! ইন্সটাফরেক্সের একজন গ্রাহক হওয়ায়, দক্ষ ট্রেডিং এর জন্য আপনাকে অনেক সেবা বিনামূল্যে প্রদান করা হয়।


