


Legenda dalam pasukan InstaSpot!
Legenda! Anda fikir ia adalah satu retorik yang besar? Tetapi bagaimana untuk kita memanggil seorang lelaki, yang telah menjadi pemain Asia pertama yang memenangi kejohanan catur dunia junior pada usia 18 tahun dan menjadi Grandmaster India pertama pada usia 19 tahun? Itulah permulaan yang sukar untuk merangkul gelaran Juara Dunia untuk Viswanathan Anand, seorang juara yang telah menjadi sebahagian daripada sejarah catur. Kini satu lagi legenda dalam pasukan InstaSpot!


Borussia adalah salah satu kelab bola sepak paling terkemuka di Jerman, yang telah berulang kali membuktikan kepada peminatnya: semangat persaingan dan kepemimpinan pasti akan membawa kepada kejayaan. Berdagang dengan cara yang sama seperti atlet sukan profesional beraksi menentang lawan: yakin dan aktif. Simpan "hantaran" dari Borussia FC dan menjadi pedagang hebat dengan InstaSpot!

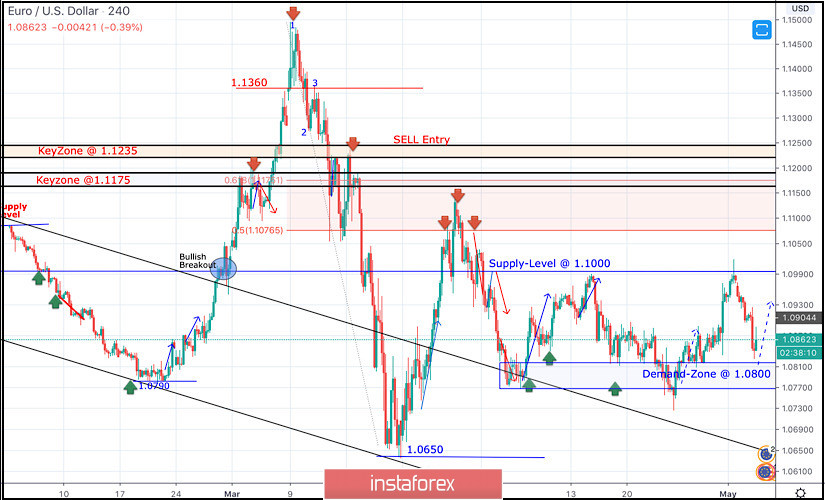
Few weeks ago, the EURUSD pair has expressed significant bullish recovery around the newly-established bottom around 1.0650.
Bullish engulfing H4 candlesticks as well as the recently-demonstrated ascending bottoms indicated a high probability bullish pullback at least towards 1.0980 and 1.1075 (Fibonacci Level 50%).
Key Supply-Levels in confluence with significant Fibonacci levels are located around 1.1075 (50% Fibonacci) and 1.1175 (61.8% Fibonacci) where bearish rejection was highly-expected upon the previous bullish pullback that took place on March 27.
Thus, a bearish Head & Shoulders pattern was demonstrated around the price levels of (1.1000 - 1.1150).
Further bearish decline was demonstrated towards 1.0800 where the nearest demand level to be considered was located near the backside of the broken channel (1.0800-1.0750).
Evident signs of Bullish rejection have been manifested around the price zone of (1.0800-1.0750) leading to the recent bullish spike up to 1.0990.
The short-term technical bullish outlook remains valid as long as bullish persistence is maintained above the recently-established ascending Bottom around 1.0770.
Further bullish advancement is expected to pursue beyond 1.1000 towards 1.1175 where 61.8% Fibonacci Level is located.
Bullish breakout above 1.1000 was needed to enhance further bullish movement towards 1.1075 and probably 1.1150. However, lack of bullish momentum prevented so.
Despite the recent bearish decline, the price zone of (1.0815 - 1.0775) stands as a prominent Demand Zone which may provide quite good bullish support for the pair.
On the other hand, Any bearish breakdown below 1.0770 should be market as an Exit signal for all short-term BUY trades.
Trade recommendations :
Intraday traders are advised to wait for more bearish pullback towards the price zone of 1.0815 - 1.0775 for another short-term BUY trade.
S/L should be placed at 1.0750 while T/P levels to be located around 1.0930, 1.1000 then 1.1075 if sufficient bullish momentum is maintained.
* Analisis pasaran yang disiarkan di sini adalah bertujuan untuk meningkatkan kesedaran anda, tetapi tidak untuk memberi arahan untuk membuat perdagangan.
Kajian analisis InstaSpot akan membuat anda mengetahui sepenuhnya aliran pasaran! Sebagai pelanggan InstaSpot, anda disediakan sejumlah besar perkhidmatan percuma untuk dagangan yang cekap.


