


Đội ngũ của chúng tôi có hơn 7,000,000 thương nhân!
Hàng ngày chúng tôi làm việc cùng nhau để cải thiện việc giao dịch. Chúng tôi nhận được kết quả cao và luôn tiến lên phía trước.
Sự công nhận của hàng triệu thương nhân trên toàn thế giới là sự đánh giá tốt nhất cho công việc của chúng tôi! Bạn đã đưa ra quyết định của mình và chúng tôi sẽ làm mọi thứ cần thiết để đáp ứng mong đợi của bạn!
Chúng ta cùng với nhau sẽ là một nhóm tuyệt vời!
InstaSpot. Tự hào làm việc cho bạn!


Diễn viên, nhà vô địch mùa giải UFC 6 và là người hùng thật sự!
Người tự mình làm nên tất cả. Người đàn ông đáng kể học hỏi.
Bí mật đằng sau thành công của Taktarov là sự cố gắng liên tục hướng tới mục tiêu.
Hãy khai phá tất cả các mặt tài năng của bạn!
Khám phá, thử, thất bại - nhưng không bao giờ dừng lại!
InstaSpot. Câu chuyện thành công của bạn bắt đầu từ đây!
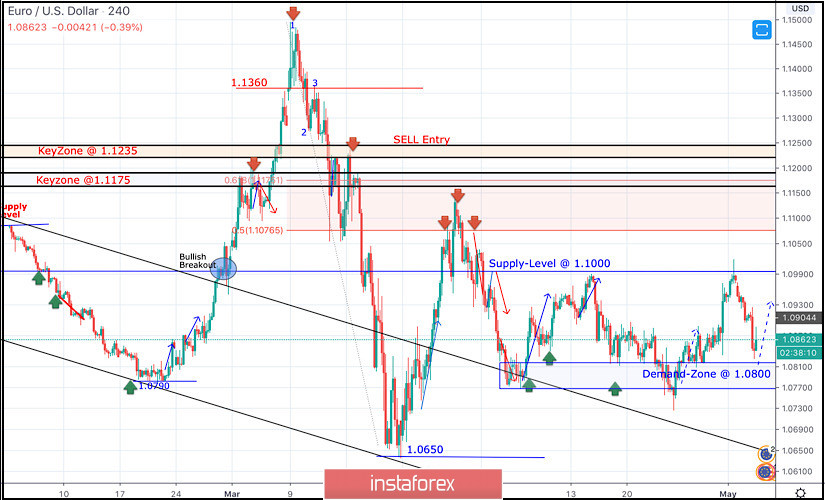
Few weeks ago, the EURUSD pair has expressed significant bullish recovery around the newly-established bottom around 1.0650.
Bullish engulfing H4 candlesticks as well as the recently-demonstrated ascending bottoms indicated a high probability bullish pullback at least towards 1.0980 and 1.1075 (Fibonacci Level 50%).
Key Supply-Levels in confluence with significant Fibonacci levels are located around 1.1075 (50% Fibonacci) and 1.1175 (61.8% Fibonacci) where bearish rejection was highly-expected upon the previous bullish pullback that took place on March 27.
Thus, a bearish Head & Shoulders pattern was demonstrated around the price levels of (1.1000 - 1.1150).
Further bearish decline was demonstrated towards 1.0800 where the nearest demand level to be considered was located near the backside of the broken channel (1.0800-1.0750).
Evident signs of Bullish rejection have been manifested around the price zone of (1.0800-1.0750) leading to the recent bullish spike up to 1.0990.
The short-term technical bullish outlook remains valid as long as bullish persistence is maintained above the recently-established ascending Bottom around 1.0770.
Further bullish advancement is expected to pursue beyond 1.1000 towards 1.1175 where 61.8% Fibonacci Level is located.
Bullish breakout above 1.1000 was needed to enhance further bullish movement towards 1.1075 and probably 1.1150. However, lack of bullish momentum prevented so.
Despite the recent bearish decline, the price zone of (1.0815 - 1.0775) stands as a prominent Demand Zone which may provide quite good bullish support for the pair.
On the other hand, Any bearish breakdown below 1.0770 should be market as an Exit signal for all short-term BUY trades.
Trade recommendations :
Intraday traders are advised to wait for more bearish pullback towards the price zone of 1.0815 - 1.0775 for another short-term BUY trade.
S/L should be placed at 1.0750 while T/P levels to be located around 1.0930, 1.1000 then 1.1075 if sufficient bullish momentum is maintained.
*Phân tích thị trường được đăng tải ở đây có nghĩa là để gia tăng nhận thức của bạn, nhưng không đưa ra các chỉ dẫn để thực hiện một giao dịch.
InstaSpot analytical reviews will make you fully aware of market trends! Being an InstaSpot client, you are provided with a large number of free services for efficient trading.


