




Nella nostra squadra ci sono più di 7.000.000 trader! Ogni giorno ci impegniamo a far sì che il trading migliori. Conseguiamo grandi risultati e ci muoviamo in avanti.
Il riconoscimento da parte di milioni di trader in tutto il mondo rappresenta l'alta valutazione della nostra attività! Voi avete fatto la vostra scelta e noi faremo la nostra al fine di soddisfare le vostre aspettative!
Assieme siamo una grande squadra!
InstaSpot. Siamo orgogliosi di lavorare per voi!





Attore, campione del mondo di lotta libera e semplicemente un vero maciste russo! Persona venuta dal nulla. Persona che rispecchia i nostri obiettivi. Il segreto del successo di Taktarov consiste nel mirare continuamente al suo scopo.
Dischiudi anche tu tutti gli aspetti del tuo talento! Impara, prova, sbaglia, ma non fermarti!
InstaSpot - la storia delle tue vittorie inizia qui!

Record inflows into gold ETFs. According to the World Gold Council, global gold ETFs attracted $10 billion in September, and cumulative inflows for Q3 reached a record $31 billion. Despite an 8.5% decline in gold prices in September, purchases rose 67 tonnes to a record 4,256 tonnes. This indicates institutional investors view the current correction as an opportunity to add positions rather than exit.
Sustained central bank purchases. In August, central banks reported net purchases of 39 tonnes, bringing cumulative purchases year-to-date to 170 tonnes. The People's Bank of China increased reserves by 20 tonnes in August — the 22nd consecutive month — raising total holdings to 2,387 tonnes. Poland remains the largest buyer year-to-date (98 tonnes), approaching its target of 700 tonnes. This structural demand is independent of short-term Federal Reserve decisions.
Geopolitical tension remains in the background. Houthi attacks on Riyadh's international airport over the weekend killed 12 people, and President Trump allowed for possible US involvement in retaliatory strikes. The situation around the Strait of Hormuz continues to create energy supply risks, supporting a geopolitical risk premium.
A strong dollar remains the main headwind. The USDX trades around 102.30–102.40, holding near 18-month highs. A strong dollar makes gold more expensive for holders of other currencies and limits upside potential.
Bond yields at multi-year highs. The 10-year US Treasury yield holds near 5.24%, close to last week's peak of 5.36% — the highest level since 2002. For gold, which yields no interest, this represents a high opportunity cost of holding the metal.
Rising oil prices increase inflationary risks. Brent trades above $103 per barrel after Iran rejected the US proposal to reopen navigation in the Strait of Hormuz as insufficient. Higher energy prices boost inflation expectations, supporting a hawkish Fed stance and pressuring gold.
The market awaits CPI. Investors avoid opening large positions ahead of the US inflation print on Wednesday. Consensus forecasts imply headline annual inflation will accelerate to 3.7% from 3.4% and core CPI will rise to 2.5% from 2.4%. Strong data could revive expectations of an October rate hike, which would pressure gold.
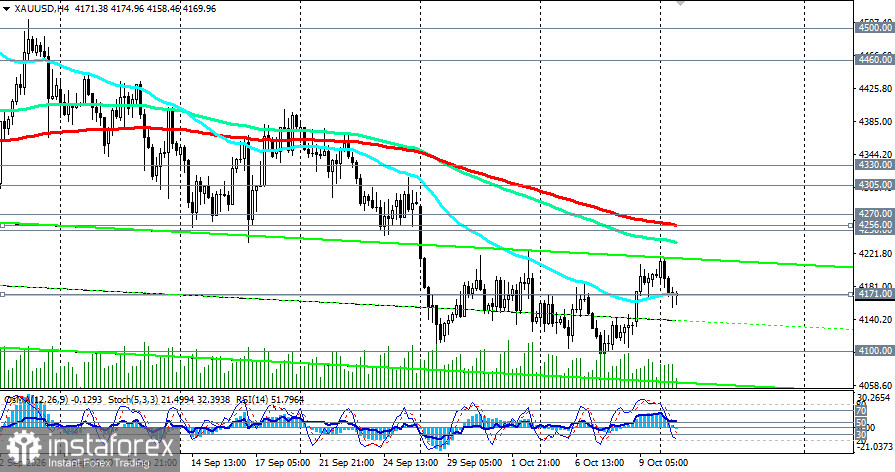
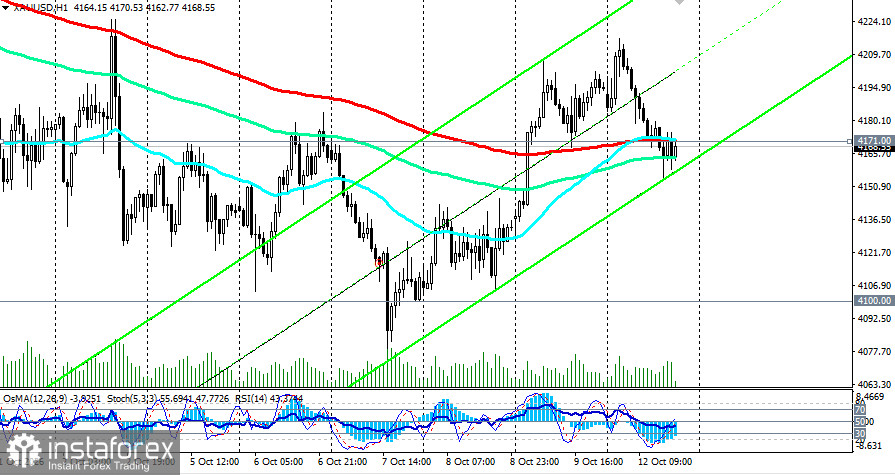
The technical picture remains bearish, but the metal shows signs of stabilization.
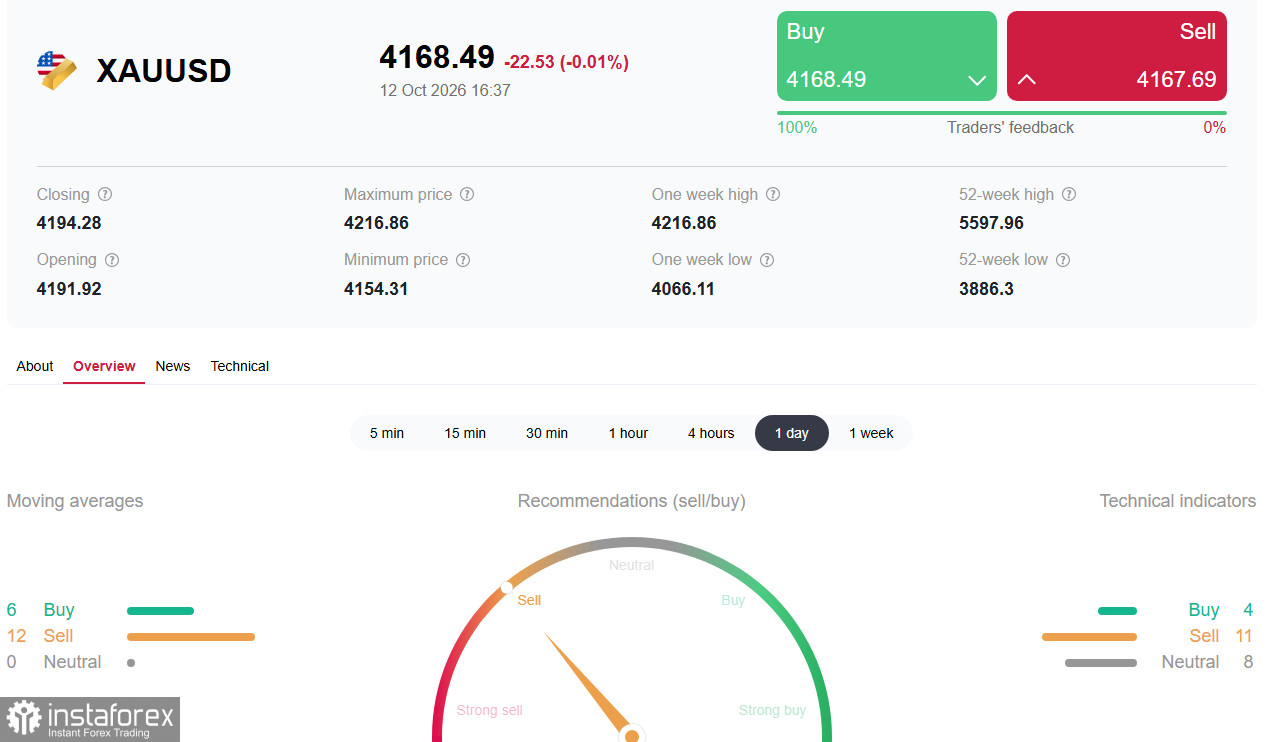
Consolidated technical analysis on the hourly chart signals "Sell": 11 of 23 applied indicators favor short positions.
Gold has traded between 4100 and 4200 for two weeks, and neither bulls nor bears show strong conviction. RSI (14) on the daily chart is around 44, below the neutral 50, indicating weak buying interest.
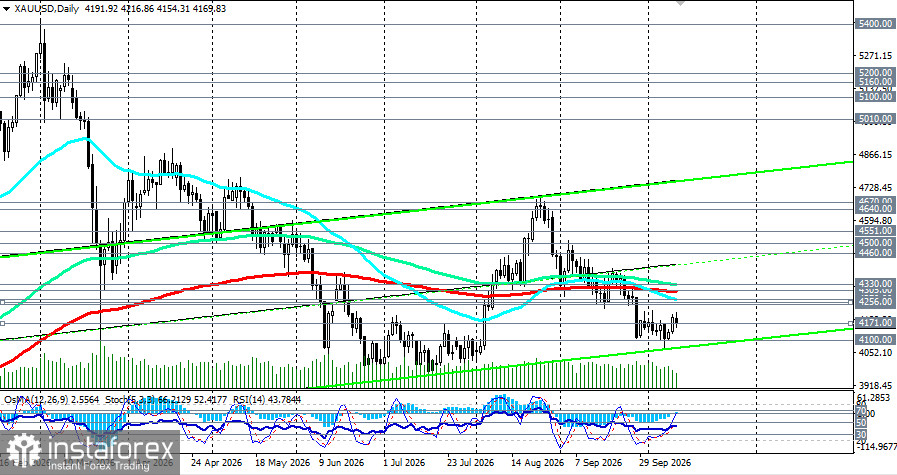
Gold consolidates near 4170.00, stuck between support 4100.00 and resistance 4225.00. The key level for bulls remains 4230.00; for bears — 4150.00.
For short-term traders:
For medium?term investors:
Risk management:
This review is based on open sources and media reports and represents an analysis of price dynamics affected by many factors; risk management and position control are therefore especially important.
*La presente analisi del mercato ha un carattere esclusivamente informativo e non rappresenta una guida per l`effettuazione di una transazione.
Le recensioni analitiche di InstaSpot ti renderanno pienamente consapevole delle tendenze del mercato! Essendo un cliente InstaSpot, ti viene fornito un gran numero di servizi gratuiti per il trading efficiente.


