




Nella nostra squadra ci sono più di 7.000.000 trader! Ogni giorno ci impegniamo a far sì che il trading migliori. Conseguiamo grandi risultati e ci muoviamo in avanti.
Il riconoscimento da parte di milioni di trader in tutto il mondo rappresenta l'alta valutazione della nostra attività! Voi avete fatto la vostra scelta e noi faremo la nostra al fine di soddisfare le vostre aspettative!
Assieme siamo una grande squadra!
InstaSpot. Siamo orgogliosi di lavorare per voi!





Attore, campione del mondo di lotta libera e semplicemente un vero maciste russo! Persona venuta dal nulla. Persona che rispecchia i nostri obiettivi. Il segreto del successo di Taktarov consiste nel mirare continuamente al suo scopo.
Dischiudi anche tu tutti gli aspetti del tuo talento! Impara, prova, sbaglia, ma non fermarti!
InstaSpot - la storia delle tue vittorie inizia qui!

Bitcoin failed to hold above the $65,000 level and has begun a gradual decline. Ethereum followed suit and is currently trading at $1,897, below the key psychological $2,000 level.

Despite Bitcoin's recent strong rally, one of the key indicators of institutional demand is sending the opposite signal. The premium index, which measures the difference between Bitcoin's price on U.S. exchanges and on other major global trading venues, has remained negative for 80 consecutive days since May 19, marking the longest such period on record. A negative premium means that Bitcoin is trading at a discount to the global average, indicating that U.S. investors are not competing for the asset as aggressively as participants in other markets. As a result, buying pressure from the United States remains weaker than global demand.
The primary reason behind the prolonged weakness in demand from U.S. traders is not so much capital leaving the cryptocurrency market altogether, but rather its reallocation within the digital asset sector itself. According to CoinGecko, cryptocurrency exchanges processed $1.32 trillion in tokenized perpetual futures linked to stocks, equity indices, and commodities during the first five months of 2026—more than twelve times the volume recorded during all of 2025. CoinDesk describes this trend as a reverse bridge: whereas Wall Street previously entered the crypto market through exchange-traded funds (ETFs) and custodial services, cryptocurrency exchanges are now bringing stocks, commodities, and indices onto their own on-chain trading infrastructure.
However, this indicator alone should not be used to draw definitive conclusions, as it is influenced not only by investor sentiment but also by liquidity, trading hours, and the participant profile of individual exchanges. Nevertheless, the combination of a prolonged negative premium, continued outflows from spot Bitcoin ETFs, and the sharp decline in the probability of the CLARITY Act being passed—to just 16%—suggests that the price gains seen in recent weeks have been driven more by a relatively narrow group of committed buyers and corporate treasuries than by broad-based demand from traditional U.S. institutional investors.
As for short-term trading, the strategy and trading scenarios are outlined below.
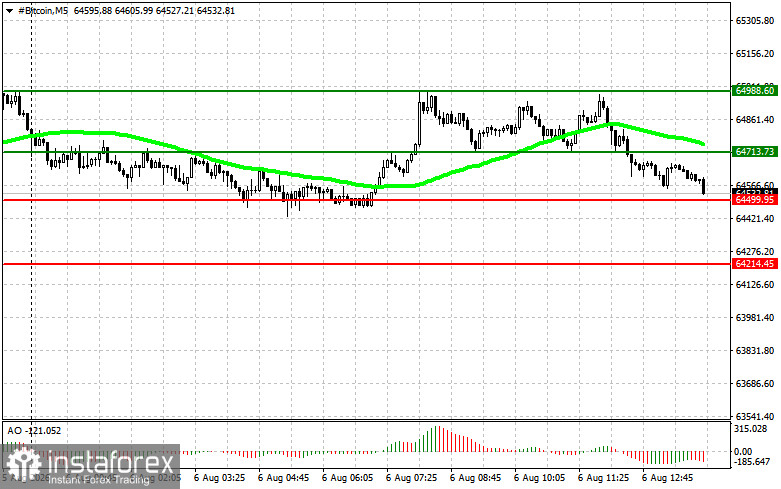
Scenario 1: Buy Bitcoin upon a breakout to $64,700, with an upward target of $64,900. At $64,900, consider closing long positions and opening short positions on a rebound. Before buying the breakout, make sure that the 50-day moving average is below the current price and that the Awesome Oscillator is above the zero line.
Scenario 2: Buy Bitcoin from the $64,500 support level if the market fails to develop downward momentum after breaking below it, targeting $64,700 and $64,900.
Scenario 1: Sell Bitcoin upon a breakout to $64,500, with a downward target of $64,200. At $64,200, consider closing short positions and opening long positions on a rebound. Before selling the breakout, make sure that the 50-day moving average is above the current price and that the Awesome Oscillator is below the zero line.
Scenario 2: Sell Bitcoin from the $64,700 resistance level if the market fails to continue higher after breaking above it, targeting $64,500 and $64,200.
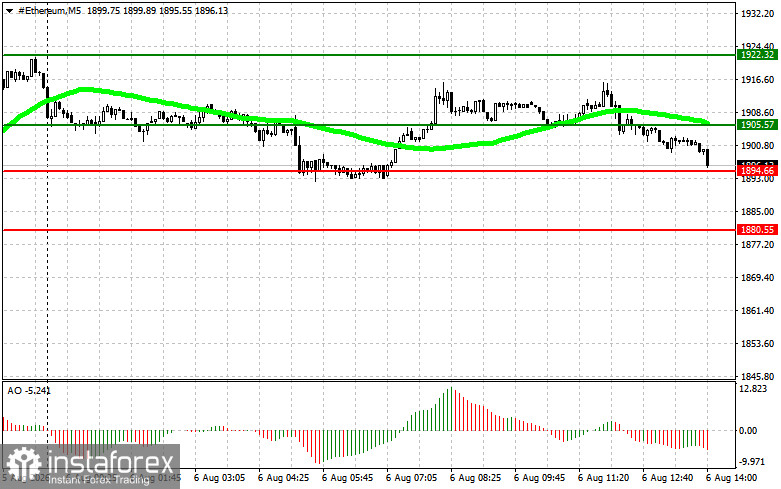
Scenario 1: Buy Ethereum upon a breakout to $1,905, with an upward target of $1,922. At $1,922, consider closing long positions and opening short positions on a rebound. Before buying the breakout, make sure that the 50-day moving average is below the current price and that the Awesome Oscillator is above the zero line.
Scenario 2: Buy Ethereum from the $1,894 support level if the market fails to develop downward momentum after breaking below it, targeting $1,905 and $1,922.
Scenario 1: Sell Ethereum upon a breakout to $1,894, with a downward target of $1,880. At $1,880, consider closing short positions and opening long positions on a rebound. Before selling the breakout, make sure that the 50-day moving average is above the current price and that the Awesome Oscillator is below the zero line.
Scenario 2: Sell Ethereum from the $1,905 resistance level if the market fails to continue higher after breaking above it, targeting $1,894 and $1,880.
*La presente analisi del mercato ha un carattere esclusivamente informativo e non rappresenta una guida per l`effettuazione di una transazione.
Le recensioni analitiche di InstaSpot ti renderanno pienamente consapevole delle tendenze del mercato! Essendo un cliente InstaSpot, ti viene fornito un gran numero di servizi gratuiti per il trading efficiente.


