




Nossa equipe tem mais de 7,000,000 traders!
Todos os dias, trabalhamos juntos para melhorar a negociação. Obtivemos resultados elevados e avançamos.
O reconhecimento de milhões de traders em todo o mundo é a melhor apreciação do nosso trabalho! Você nos escolheu e faremos tudo o que for necessário para atender às suas expectativas!
Nós somos uma ótima equipe juntos!
InstaSpot. Orgulho de trabalhar para você!





Ator, hexacampeão do UFC e um verdadeiro herói!
Um homem de sucesso. Um homem que mostra o nosso caminho.
O segredo por trás do sucesso de Taktarov é um movimento constante em direção ao objetivo.
Revele todos os lados do seu talento!
Descubra, tente, falhe, mas nunca pare!
I InstaSpot. Sua história de sucesso começa aqui!
Bitcoin failed to hold above the $65,000 level and has begun a gradual decline. Ethereum followed suit and is currently trading at $1,897, below the key psychological $2,000 level.

Despite Bitcoin's recent strong rally, one of the key indicators of institutional demand is sending the opposite signal. The premium index, which measures the difference between Bitcoin's price on U.S. exchanges and on other major global trading venues, has remained negative for 80 consecutive days since May 19, marking the longest such period on record. A negative premium means that Bitcoin is trading at a discount to the global average, indicating that U.S. investors are not competing for the asset as aggressively as participants in other markets. As a result, buying pressure from the United States remains weaker than global demand.
The primary reason behind the prolonged weakness in demand from U.S. traders is not so much capital leaving the cryptocurrency market altogether, but rather its reallocation within the digital asset sector itself. According to CoinGecko, cryptocurrency exchanges processed $1.32 trillion in tokenized perpetual futures linked to stocks, equity indices, and commodities during the first five months of 2026—more than twelve times the volume recorded during all of 2025. CoinDesk describes this trend as a reverse bridge: whereas Wall Street previously entered the crypto market through exchange-traded funds (ETFs) and custodial services, cryptocurrency exchanges are now bringing stocks, commodities, and indices onto their own on-chain trading infrastructure.
However, this indicator alone should not be used to draw definitive conclusions, as it is influenced not only by investor sentiment but also by liquidity, trading hours, and the participant profile of individual exchanges. Nevertheless, the combination of a prolonged negative premium, continued outflows from spot Bitcoin ETFs, and the sharp decline in the probability of the CLARITY Act being passed—to just 16%—suggests that the price gains seen in recent weeks have been driven more by a relatively narrow group of committed buyers and corporate treasuries than by broad-based demand from traditional U.S. institutional investors.
As for short-term trading, the strategy and trading scenarios are outlined below.
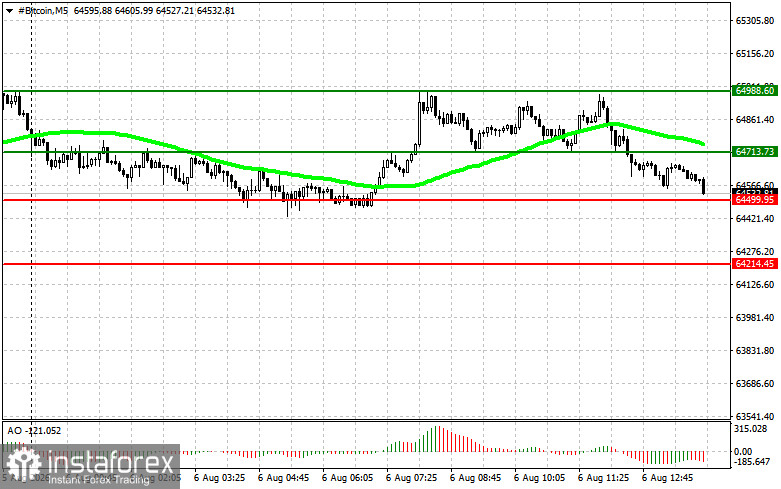
Scenario 1: Buy Bitcoin upon a breakout to $64,700, with an upward target of $64,900. At $64,900, consider closing long positions and opening short positions on a rebound. Before buying the breakout, make sure that the 50-day moving average is below the current price and that the Awesome Oscillator is above the zero line.
Scenario 2: Buy Bitcoin from the $64,500 support level if the market fails to develop downward momentum after breaking below it, targeting $64,700 and $64,900.
Scenario 1: Sell Bitcoin upon a breakout to $64,500, with a downward target of $64,200. At $64,200, consider closing short positions and opening long positions on a rebound. Before selling the breakout, make sure that the 50-day moving average is above the current price and that the Awesome Oscillator is below the zero line.
Scenario 2: Sell Bitcoin from the $64,700 resistance level if the market fails to continue higher after breaking above it, targeting $64,500 and $64,200.
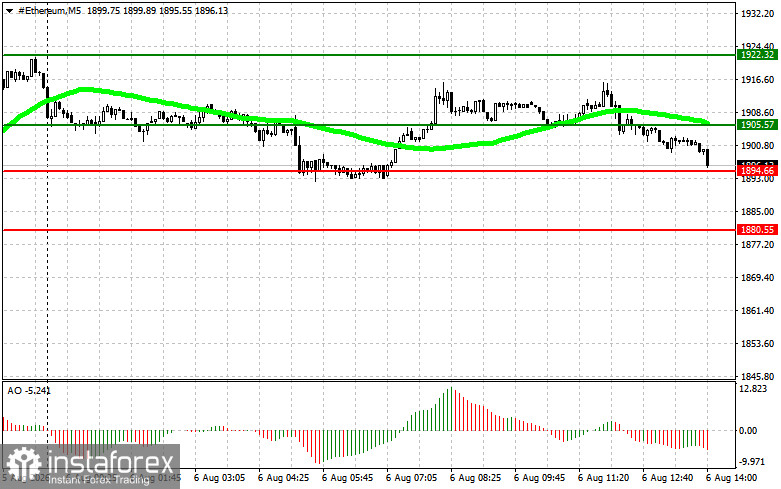
Scenario 1: Buy Ethereum upon a breakout to $1,905, with an upward target of $1,922. At $1,922, consider closing long positions and opening short positions on a rebound. Before buying the breakout, make sure that the 50-day moving average is below the current price and that the Awesome Oscillator is above the zero line.
Scenario 2: Buy Ethereum from the $1,894 support level if the market fails to develop downward momentum after breaking below it, targeting $1,905 and $1,922.
Scenario 1: Sell Ethereum upon a breakout to $1,894, with a downward target of $1,880. At $1,880, consider closing short positions and opening long positions on a rebound. Before selling the breakout, make sure that the 50-day moving average is above the current price and that the Awesome Oscillator is below the zero line.
Scenario 2: Sell Ethereum from the $1,905 resistance level if the market fails to continue higher after breaking above it, targeting $1,894 and $1,880.
*A análise de mercado aqui postada destina-se a aumentar o seu conhecimento, mas não dar instruções para fazer uma negociação.
InstaSpot analytical reviews will make you fully aware of market trends! Being an InstaSpot client, you are provided with a large number of free services for efficient trading.


