


Nella nostra squadra ci sono più di 7.000.000 trader! Ogni giorno ci impegniamo a far sì che il trading migliori. Conseguiamo grandi risultati e ci muoviamo in avanti.
Il riconoscimento da parte di milioni di trader in tutto il mondo rappresenta l'alta valutazione della nostra attività! Voi avete fatto la vostra scelta e noi faremo la nostra al fine di soddisfare le vostre aspettative!
Assieme siamo una grande squadra!
InstaSpot. Siamo orgogliosi di lavorare per voi!


Attore, campione del mondo di lotta libera e semplicemente un vero maciste russo! Persona venuta dal nulla. Persona che rispecchia i nostri obiettivi. Il segreto del successo di Taktarov consiste nel mirare continuamente al suo scopo.
Dischiudi anche tu tutti gli aspetti del tuo talento! Impara, prova, sbaglia, ma non fermarti!
InstaSpot - la storia delle tue vittorie inizia qui!

Bitcoin and Ethereum began an upward correction after a week of inactivity; however, demand remains quite low, and there is no talk of a bullish trend in the near term. Many experts note that the market "bottom" could be formed in the $40,000–$55,000 range. There are no technical signs of the end of the downtrend for either Ethereum or Bitcoin. Thus, we assume that Bitcoin and Ethereum will continue to correct for some time, although a new lower low has not been established yet. This time, the decline could resume much faster.
Meanwhile, Crypto Super Hub co?founder Jake Pahor noticed a very interesting tendency in investor behavior at different times. Mr. Pahor noted that investors are willing to buy Bitcoin at any price when they see a strong rise, without considering that the rise may end soon. At the same time, when Bitcoin falls to critically low levels but there is no strong recovery, nobody rushes to buy. Pahor noted that in February the price of Bitcoin fell to $60,000, but client activity on his exchange dropped to minimal levels. Three months later, when Bitcoin was trading at $80,000, activity increased, and investors started buying.
Thus, most investors in the leading cryptocurrency act impulsively, on emotion, rather than based on a clear strategy. Mr. Pahor noted that the current movements of Bitcoin are very similar to the 2018 bear cycle. In 2018, Bitcoin formed a bottom around $6,000, then produced a correction, and afterwards crashed even further — to $3,200. Therefore, the conclusion is simple: a Bitcoin rise without a bullish cycle is a correction. After the correction finishes, the primary movement resumes. That is why we always say you should buy on an uptrend, not try to catch the market bottom. At present, there are no signs of a beginning uptrend on the daily timeframe (TF).
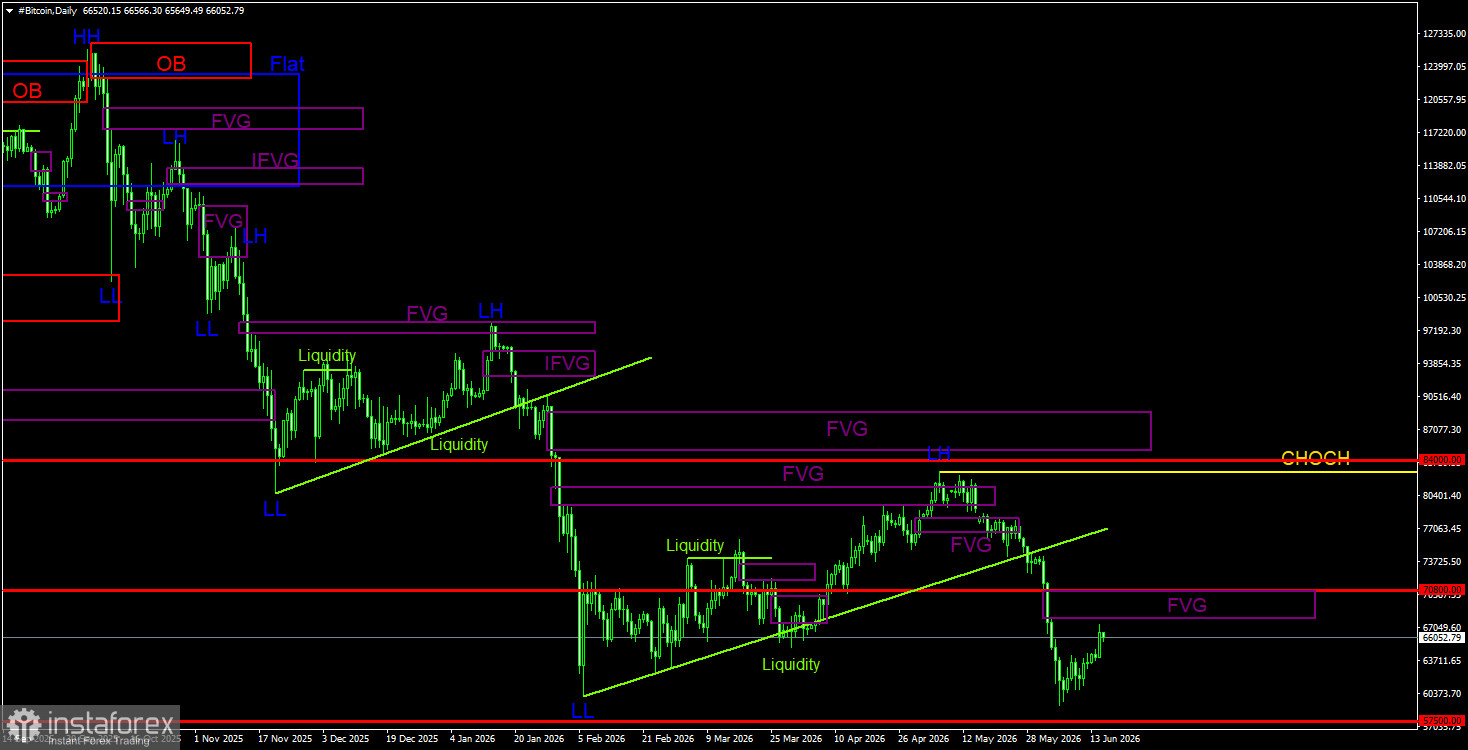
Bitcoin continues to form a full downtrend with counter-trend corrections. We continue to expect a decline targeting $57,500 (the 61.8% Fibonacci level of the three-year uptrend), and there are still no signs of an uptrend beginning. The last bearish FVG pattern formed in the $68,000–$70,700 area, so that area serves as a POI for short positions for the coming weeks. On the 4-hour TF, the cryptocurrency may correct soon, so if traders wish to trade against the trend, they can consider small longs from bullish patterns.
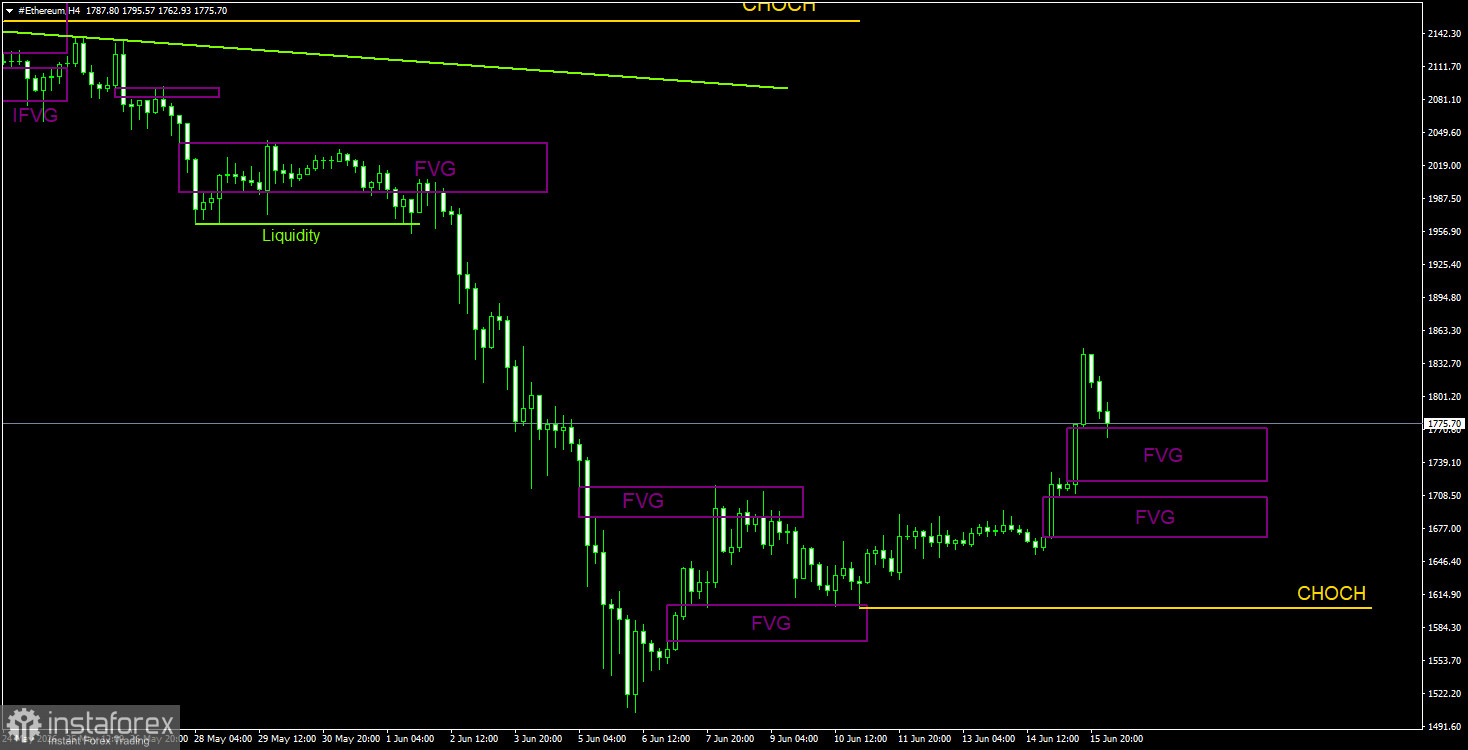
On the daily TF, a downtrend that began in August last year is still in progress. The key sell pattern was and remains the bearish order block on the weekly TF. As we warned, the movement triggered by this signal can be strong and prolonged. We do not believe it is over, since there are no signs of a downtrend ending for either Bitcoin or Ethereum. In the near term, Ethereum may resume its decline with targets at $1,391 and $788 if Bitcoin reacts to the bearish FVG on the daily TF. Until that happens, on the 4-hour TF, it is acceptable to consider small longs from bullish patterns. The nearest pattern was a bullish FVG in the $1,721–$1,771 area, which has already played out.
CHOCH — change of character / break of the trend structure. Liquidity — liquidity, traders' Stop?Losses that market?makers use to build their positions. FVG — Fair Value Gap (area of price inefficiency). The price often moves quickly through such areas, indicating the absence of one side in the market. Later, the price tends to return and react to these zones. IFVG — Inverted Fair Value Gap. After a return to such a zone, the price does not react but impulsively breaks through and then tests it from the other side.
OB — Order Block. A candle on which a market?maker opened a position in order to harvest liquidity and then form their own position in the opposite direction.
*La presente analisi del mercato ha un carattere esclusivamente informativo e non rappresenta una guida per l`effettuazione di una transazione.
Le recensioni analitiche di InstaSpot ti renderanno pienamente consapevole delle tendenze del mercato! Essendo un cliente InstaSpot, ti viene fornito un gran numero di servizi gratuiti per il trading efficiente.


