


Nella nostra squadra ci sono più di 7.000.000 trader! Ogni giorno ci impegniamo a far sì che il trading migliori. Conseguiamo grandi risultati e ci muoviamo in avanti.
Il riconoscimento da parte di milioni di trader in tutto il mondo rappresenta l'alta valutazione della nostra attività! Voi avete fatto la vostra scelta e noi faremo la nostra al fine di soddisfare le vostre aspettative!
Assieme siamo una grande squadra!
InstaSpot. Siamo orgogliosi di lavorare per voi!


Attore, campione del mondo di lotta libera e semplicemente un vero maciste russo! Persona venuta dal nulla. Persona che rispecchia i nostri obiettivi. Il segreto del successo di Taktarov consiste nel mirare continuamente al suo scopo.
Dischiudi anche tu tutti gli aspetti del tuo talento! Impara, prova, sbaglia, ma non fermarti!
InstaSpot - la storia delle tue vittorie inizia qui!

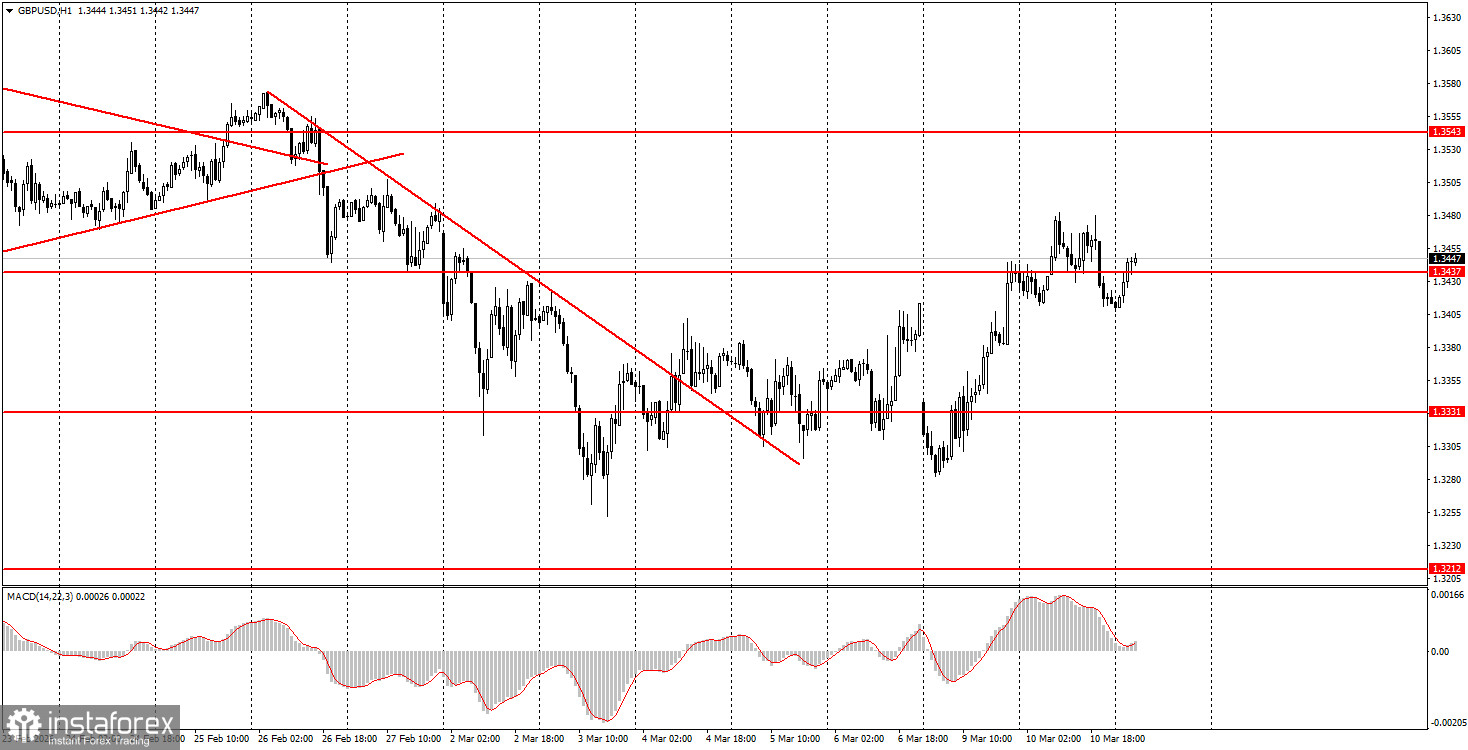
The GBP/USD pair also leaned towards growth on Tuesday, but the enthusiasm was quickly dampened. As we mentioned, the belligerent statements from Tehran prevent any relaxation and conclusions about the conflict being on a path to de-escalation. Yes, in recent days, the intensity of shelling has decreased, and countries in the region are now more concerned about restoring the destroyed oil and gas infrastructure than about war and Iran. But this does not mean the conflict is over. Trump is now demanding a complete unblocking of the Strait of Hormuz from Tehran and promises to deliver even more devastating strikes if his ultimatum is not met. Thus, the lull may be temporary. Nevertheless, if serious escalation does not occur, the euro and pound may continue to recover, as the only support for the dollar has recently been geopolitics. Yesterday, the macroeconomic background was extremely weak and had no impact on the GBP/USD pair. Formally, the formation of an upward trend has begun.
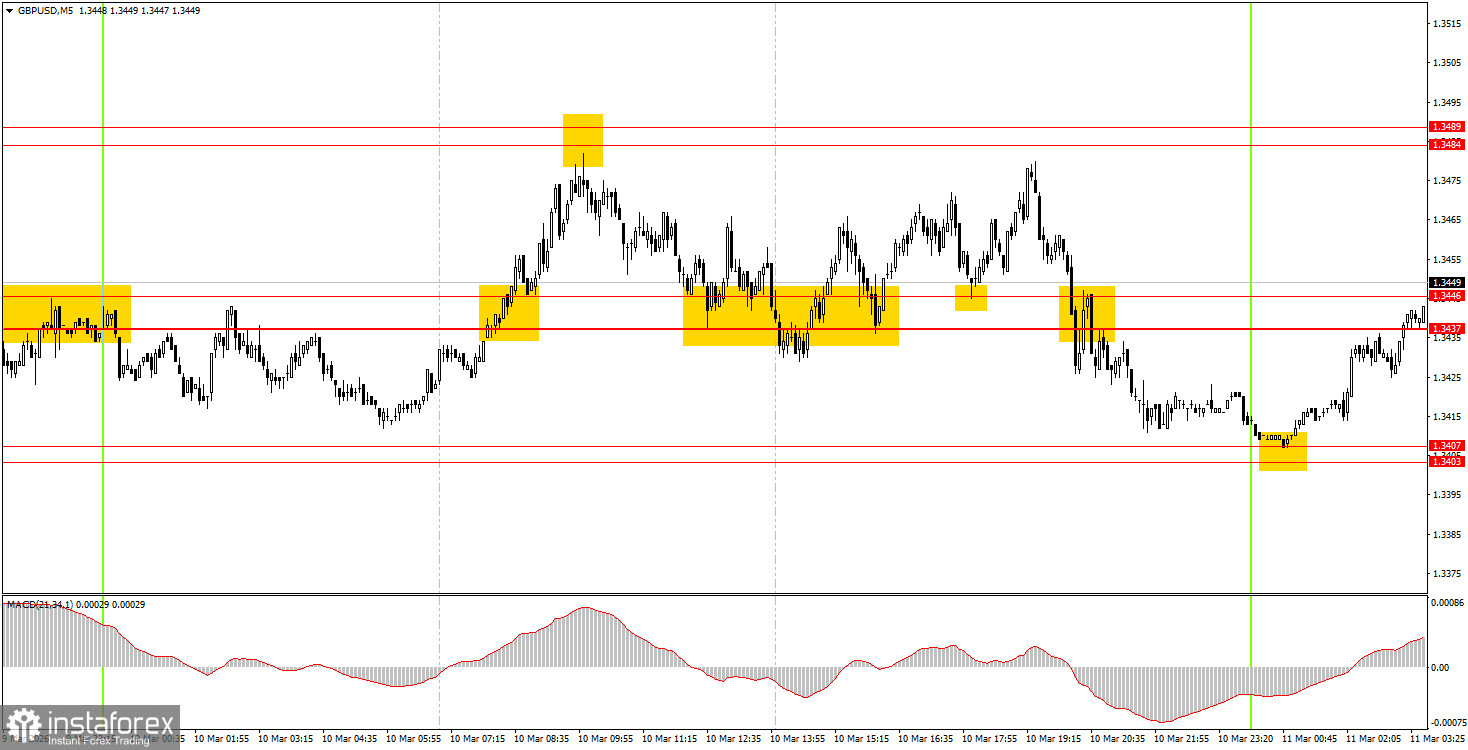
On the 5-minute timeframe, several signals were once again generated on Tuesday. It does not make sense to list all of them; the illustration above clearly shows that about half were profitable, while the other half closed at a breakeven Stop Loss. The most important thing for novice traders is that after each signal, the price moves in the desired direction by at least 20 pips. A minimum of three signals closed at Take Profit. Overnight, another buy signal was formed near the 1.3403-1.3407 area, which also closed in profit.
On the hourly timeframe, the GBP/USD pair continues to form a "geopolitical trend." There are no global foundations for medium-term dollar growth, so in 2026, we expect the continuation of the global upward trend from 2025, which could take the pair to at least 1.4000. In recent weeks, the situation has often not favored the British currency, and the market is completely focused on the war in the Middle East, which directly affects the American currency.
On Wednesday, novice traders may open long positions if the price consolidates above the 1.3437-1.3446 area, targeting 1.3484-1.3489. Consolidation below the 1.3437-1.3446 area will allow for short positions targeting 1.3403-1.3407.
On the 5-minute timeframe, trading can currently be conducted at the levels of 1.3096-1.3107, 1.3203-1.3212, 1.3259-1.3267, 1.3319-1.3331, 1.3403-1.3407, 1.3437-1.3446, 1.3484-1.3489, 1.3529-1.3543, 1.3643-1.3652, 1.3695, 1.3741-1.3751. On Wednesday, there are again no significant events or reports scheduled in the UK, while in the U.S., a fairly important consumer price index will be released. During the day, movements may once again be volatile and tumultuous.
Price levels of support and resistance are levels that serve as targets when opening buys or sells. Take Profit levels can be placed around them.
Red lines represent channels or trend lines that show the current trend and indicate the direction in which it is preferable to trade now.
The MACD indicator (14,22,3) – the histogram and the signal line – is a supporting indicator that can also be used as a source of signals.
Important speeches and reports (always included in the news calendar) can significantly affect the movement of the currency pair. Therefore, during their release, trading should be done with utmost caution, or traders should exit the market to avoid sharp price reversals against the previous movement.
Beginning traders in the forex market should remember that not every trade can be profitable. Developing a clear strategy and effective money management are the keys to long-term trading success.
*La presente analisi del mercato ha un carattere esclusivamente informativo e non rappresenta una guida per l`effettuazione di una transazione.
Le recensioni analitiche di InstaSpot ti renderanno pienamente consapevole delle tendenze del mercato! Essendo un cliente InstaSpot, ti viene fornito un gran numero di servizi gratuiti per il trading efficiente.


