


Nella nostra squadra ci sono più di 7.000.000 trader! Ogni giorno ci impegniamo a far sì che il trading migliori. Conseguiamo grandi risultati e ci muoviamo in avanti.
Il riconoscimento da parte di milioni di trader in tutto il mondo rappresenta l'alta valutazione della nostra attività! Voi avete fatto la vostra scelta e noi faremo la nostra al fine di soddisfare le vostre aspettative!
Assieme siamo una grande squadra!
InstaSpot. Siamo orgogliosi di lavorare per voi!


Attore, campione del mondo di lotta libera e semplicemente un vero maciste russo! Persona venuta dal nulla. Persona che rispecchia i nostri obiettivi. Il segreto del successo di Taktarov consiste nel mirare continuamente al suo scopo.
Dischiudi anche tu tutti gli aspetti del tuo talento! Impara, prova, sbaglia, ma non fermarti!
InstaSpot - la storia delle tue vittorie inizia qui!

Trend analysis
GBP/USD may start moving down this week, starting from the closing of last week's candle at 1.2228 to the support line at 1.2046 (thick blue line). Then, upon testing this level, the pair may rise to the historical resistance level at 1.2650 (blue dotted line).
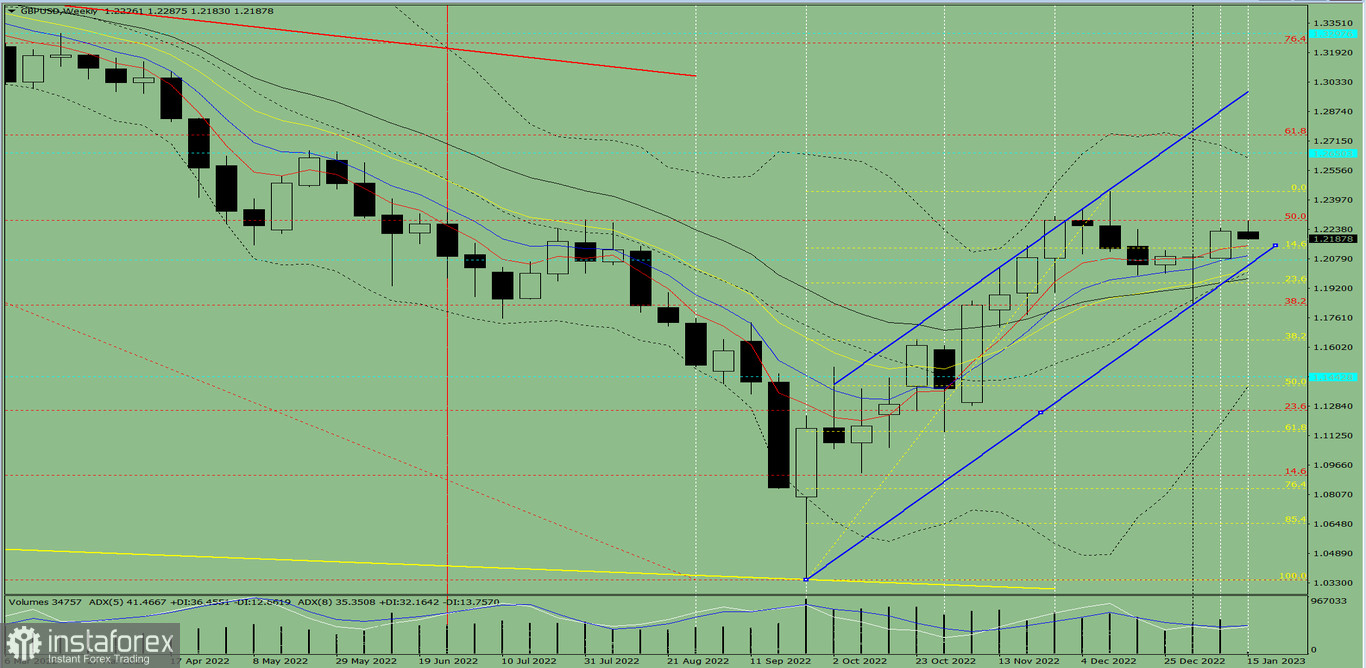
Fig. 1 (weekly chart)
Comprehensive analysis:
Indicator analysis - downtrend
Fibonacci levels - downtrend
Volumes - downtrend
Candlestick analysis - uptrend
Trend analysis - uptrend
Bollinger bands - uptrend
Monthly chart - uptrend
All this points to an upward movement in GBP/USD.
Conclusion: The pair will have a bullish trend, with a first lower shadow on the weekly white candle (Monday - down) and no second upper shadow (Friday - up).
So during the week, pound will fall from 1.2228 (closing of last week's candle) to the support line at 1.2046 (thick blue line), then bounce up to the historical resistance level at 1.2650 (blue dotted line).
Alternatively, quotes could go up from 1.2228 (closing of last week's candle) to the upper fractal at 1.2442 (yellow dotted line), then bounce down to the 14.6% retracement level at 1.2135 (yellow dotted line).
*La presente analisi del mercato ha un carattere esclusivamente informativo e non rappresenta una guida per l`effettuazione di una transazione.
Le recensioni analitiche di InstaSpot ti renderanno pienamente consapevole delle tendenze del mercato! Essendo un cliente InstaSpot, ti viene fornito un gran numero di servizi gratuiti per il trading efficiente.


