


Đội ngũ của chúng tôi có hơn 7,000,000 thương nhân!
Hàng ngày chúng tôi làm việc cùng nhau để cải thiện việc giao dịch. Chúng tôi nhận được kết quả cao và luôn tiến lên phía trước.
Sự công nhận của hàng triệu thương nhân trên toàn thế giới là sự đánh giá tốt nhất cho công việc của chúng tôi! Bạn đã đưa ra quyết định của mình và chúng tôi sẽ làm mọi thứ cần thiết để đáp ứng mong đợi của bạn!
Chúng ta cùng với nhau sẽ là một nhóm tuyệt vời!
InstaSpot. Tự hào làm việc cho bạn!


Diễn viên, nhà vô địch mùa giải UFC 6 và là người hùng thật sự!
Người tự mình làm nên tất cả. Người đàn ông đáng kể học hỏi.
Bí mật đằng sau thành công của Taktarov là sự cố gắng liên tục hướng tới mục tiêu.
Hãy khai phá tất cả các mặt tài năng của bạn!
Khám phá, thử, thất bại - nhưng không bao giờ dừng lại!
InstaSpot. Câu chuyện thành công của bạn bắt đầu từ đây!
Trend analysis
GBP/USD may start moving down this week, starting from the closing of last week's candle at 1.2228 to the support line at 1.2046 (thick blue line). Then, upon testing this level, the pair may rise to the historical resistance level at 1.2650 (blue dotted line).
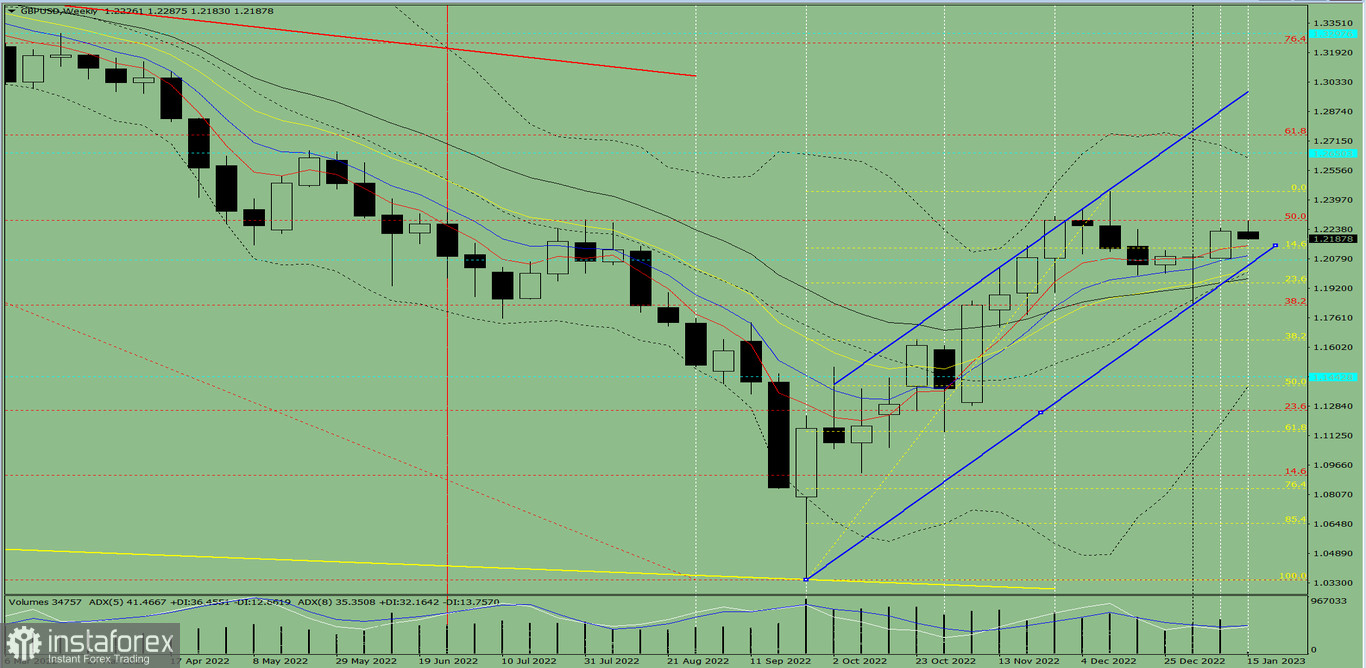
Fig. 1 (weekly chart)
Comprehensive analysis:
Indicator analysis - downtrend
Fibonacci levels - downtrend
Volumes - downtrend
Candlestick analysis - uptrend
Trend analysis - uptrend
Bollinger bands - uptrend
Monthly chart - uptrend
All this points to an upward movement in GBP/USD.
Conclusion: The pair will have a bullish trend, with a first lower shadow on the weekly white candle (Monday - down) and no second upper shadow (Friday - up).
So during the week, pound will fall from 1.2228 (closing of last week's candle) to the support line at 1.2046 (thick blue line), then bounce up to the historical resistance level at 1.2650 (blue dotted line).
Alternatively, quotes could go up from 1.2228 (closing of last week's candle) to the upper fractal at 1.2442 (yellow dotted line), then bounce down to the 14.6% retracement level at 1.2135 (yellow dotted line).
*Phân tích thị trường được đăng tải ở đây có nghĩa là để gia tăng nhận thức của bạn, nhưng không đưa ra các chỉ dẫn để thực hiện một giao dịch.
InstaSpot analytical reviews will make you fully aware of market trends! Being an InstaSpot client, you are provided with a large number of free services for efficient trading.


