


La leggenda nel team InstaSpot!!
Legenda! Pensi che sia troppo patetico? Ma come dobbiamo chiamare un uomo, che è diventato il primo dell'Asia a vincere il campionato mondiale di scacchi a 18 anni e che è diventato il primo Gran Maestro indiano a 19? Fu l'inizio di un duro cammino verso il titolo di campione del mondo, l'uomo che divenne per sempre una parte della storia di scacchi. Un'altra leggenda nel team InstaSpot!


Il Borussia è una delle squadre di calcio più titolate in Germania, che ha ripetutamente dimostrato ai tifosi che lo spirito di competizione e leadership porta al successo. Fai trading nello stesso modo in cui lo fanno i professionisti dello sport - fiduciosamente e attivamente. Segui il Borussia FC e sii avanti con InstaSpot!

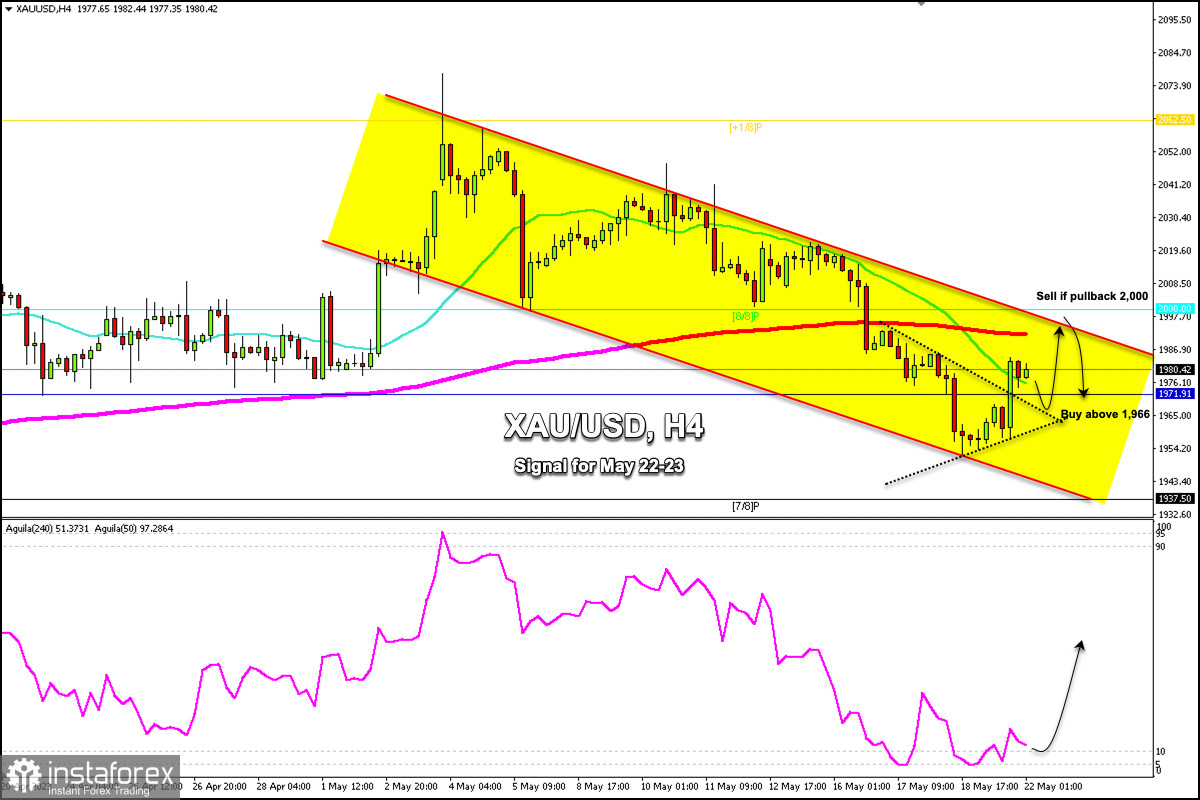
Early in the European session, Gold (XAU/USD) is trading around 1,980.42 above the 21 SMA located at 1,975 and below the 200 EMA at 1,993. The 4-hour chart shows that the XAU/USD pair made a strong technical rebound after reaching the low of around 1,951.
It is likely that gold could continue to rise, but for this, we should expect a retracement towards the 1,966 zone which represents the 61.8% Fibonacci of the last bullish momentum.
In the chart, we can see that gold broke sharply from the symmetrical triangle pattern. Is probable that if gold trades above 1,965 there is a chance that in the next few days, it could reach the EMA 200 located at 1,993 and finally, it could reach the psychological level of $2,000, an area that coincides with the top in the downtrend channel formed since the beginning of May.
On the other hand, in case gold falls and breaks below the 1,960 zone, it is expected that there will be a bearish acceleration and the instrument could reach 7/8 Murray located at 1,937, the level that coincides with the bottom of the bearish trend channel.
On May 17, and 18, the Eagle indicator reached the extreme oversold zone. So, we expect that in the next few hours, there could be a technical rebound and the price could reach the resistance zone of 1,995.
Our trading plan for the next few hours is to wait for a technical correction of the last bullish impulse around 1,971 (daily pivot point) or 1,966 (61.8% Fibonacci). Both levels represent a support zone which could be viewed as an opportunity to buy with targets at 1,995 and 2,000.
*La presente analisi del mercato ha un carattere esclusivamente informativo e non rappresenta una guida per l`effettuazione di una transazione.
Le recensioni analitiche di InstaSpot ti renderanno pienamente consapevole delle tendenze del mercato! Essendo un cliente InstaSpot, ti viene fornito un gran numero di servizi gratuiti per il trading efficiente.


