


Легендата в екипа на ИнстаФорекс!
Легенда! Мислите ли, че това е бомбастична реторика? Но как да наречем човек, който на 18 години стана първият азиатец спечелил световния шампионат по шах за юноши и на 19 години стана първият гросмайстор на Индия? Това беше началото на труден път към титлата на световен шампион за Вишванатан Ананд, човекът, който стана част от историята на шаха завинаги. Сега още една легенда в екипа на ИнстаФорекс!


Борусия е един от най-титулуваните футболни клубове в Германия, който многократно се е доказал пред феновете: духът на конкуренция и лидерство със сигурност ще доведе до успех. Търгувайте по същия начин, по който спортните професионалисти играят играта: уверено и активно. Запазете „пас" от ФК „Борусия" и бъдете начело с ИнстаФорекс!

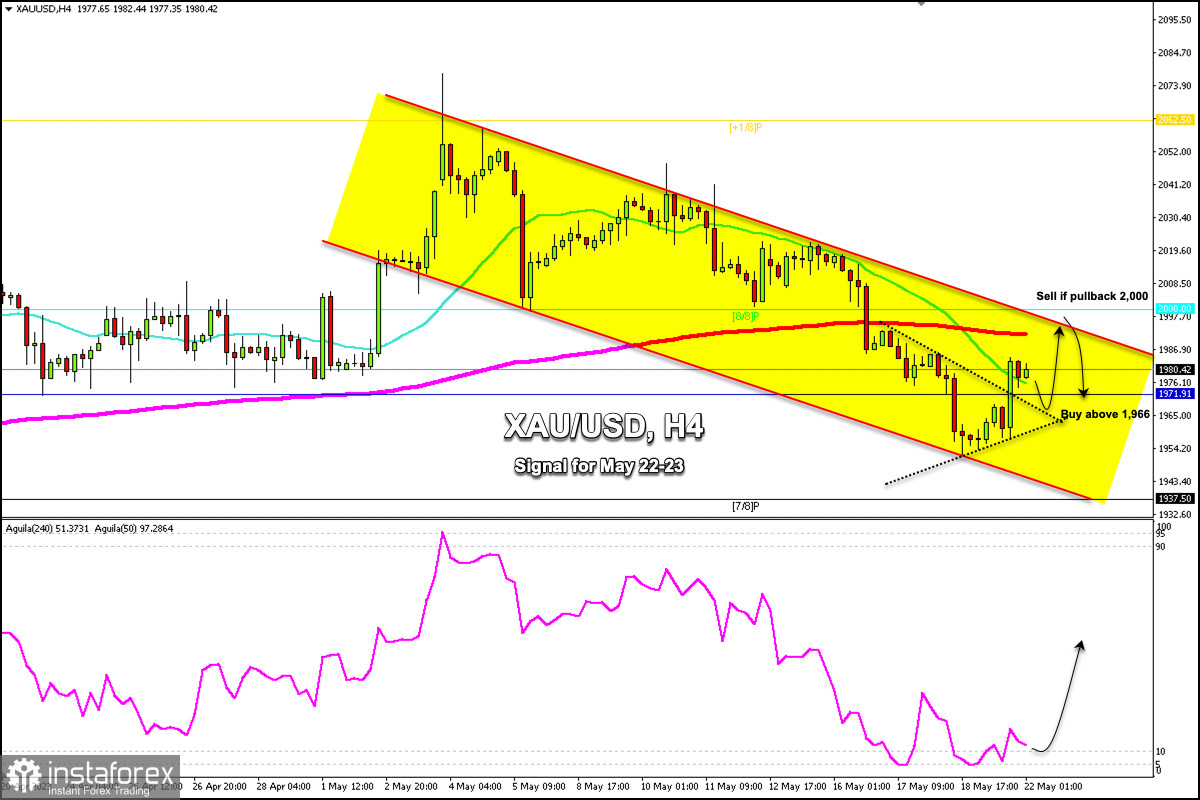
Early in the European session, Gold (XAU/USD) is trading around 1,980.42 above the 21 SMA located at 1,975 and below the 200 EMA at 1,993. The 4-hour chart shows that the XAU/USD pair made a strong technical rebound after reaching the low of around 1,951.
It is likely that gold could continue to rise, but for this, we should expect a retracement towards the 1,966 zone which represents the 61.8% Fibonacci of the last bullish momentum.
In the chart, we can see that gold broke sharply from the symmetrical triangle pattern. Is probable that if gold trades above 1,965 there is a chance that in the next few days, it could reach the EMA 200 located at 1,993 and finally, it could reach the psychological level of $2,000, an area that coincides with the top in the downtrend channel formed since the beginning of May.
On the other hand, in case gold falls and breaks below the 1,960 zone, it is expected that there will be a bearish acceleration and the instrument could reach 7/8 Murray located at 1,937, the level that coincides with the bottom of the bearish trend channel.
On May 17, and 18, the Eagle indicator reached the extreme oversold zone. So, we expect that in the next few hours, there could be a technical rebound and the price could reach the resistance zone of 1,995.
Our trading plan for the next few hours is to wait for a technical correction of the last bullish impulse around 1,971 (daily pivot point) or 1,966 (61.8% Fibonacci). Both levels represent a support zone which could be viewed as an opportunity to buy with targets at 1,995 and 2,000.
*Анализът на пазара публикуван тук има за цел да повиши информираността Ви, но не и да дава указания за търговия.
Аналитичните прегледи на ИнстаФорекс ще ви запознаят изцяло с пазарните тенденции! Като клиент на ИнстаФорекс, на вас се предоставят голям брой безплатни услуги за ефикасна търговия.


