


Nella nostra squadra ci sono più di 7.000.000 trader! Ogni giorno ci impegniamo a far sì che il trading migliori. Conseguiamo grandi risultati e ci muoviamo in avanti.
Il riconoscimento da parte di milioni di trader in tutto il mondo rappresenta l'alta valutazione della nostra attività! Voi avete fatto la vostra scelta e noi faremo la nostra al fine di soddisfare le vostre aspettative!
Assieme siamo una grande squadra!
InstaSpot. Siamo orgogliosi di lavorare per voi!


Attore, campione del mondo di lotta libera e semplicemente un vero maciste russo! Persona venuta dal nulla. Persona che rispecchia i nostri obiettivi. Il segreto del successo di Taktarov consiste nel mirare continuamente al suo scopo.
Dischiudi anche tu tutti gli aspetti del tuo talento! Impara, prova, sbaglia, ma non fermarti!
InstaSpot - la storia delle tue vittorie inizia qui!

US durable goods orders data surprised traders with a divergence in expectations. Forecasts predicted a decline of 0.3% in May, but actual data showed orders increased by 0.7%.
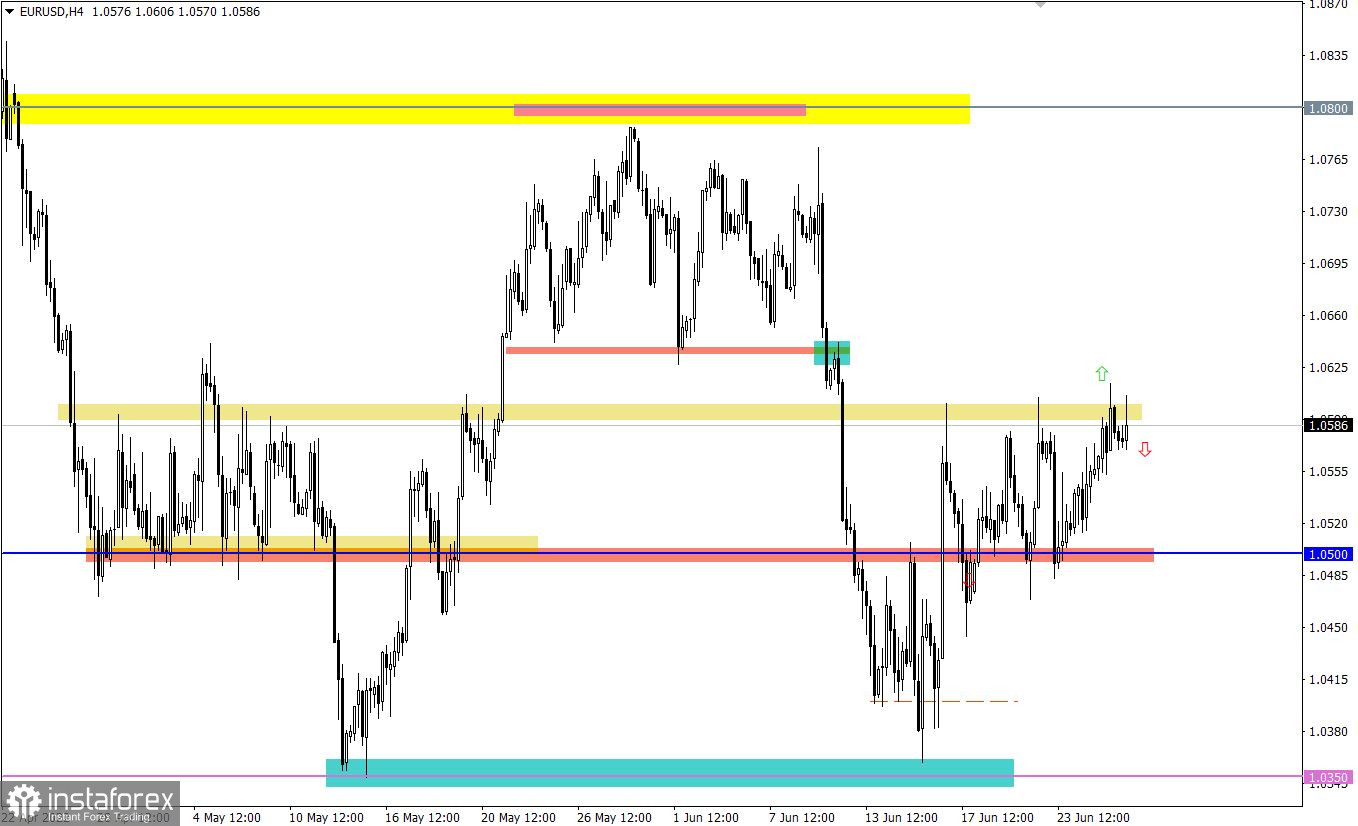
The EURUSD currency pair slowed down the upward pace after the price approached the upper flat line 1.0500/1.0600. This move led to a reduction in the volume of long positions and, as a result, a pullback.
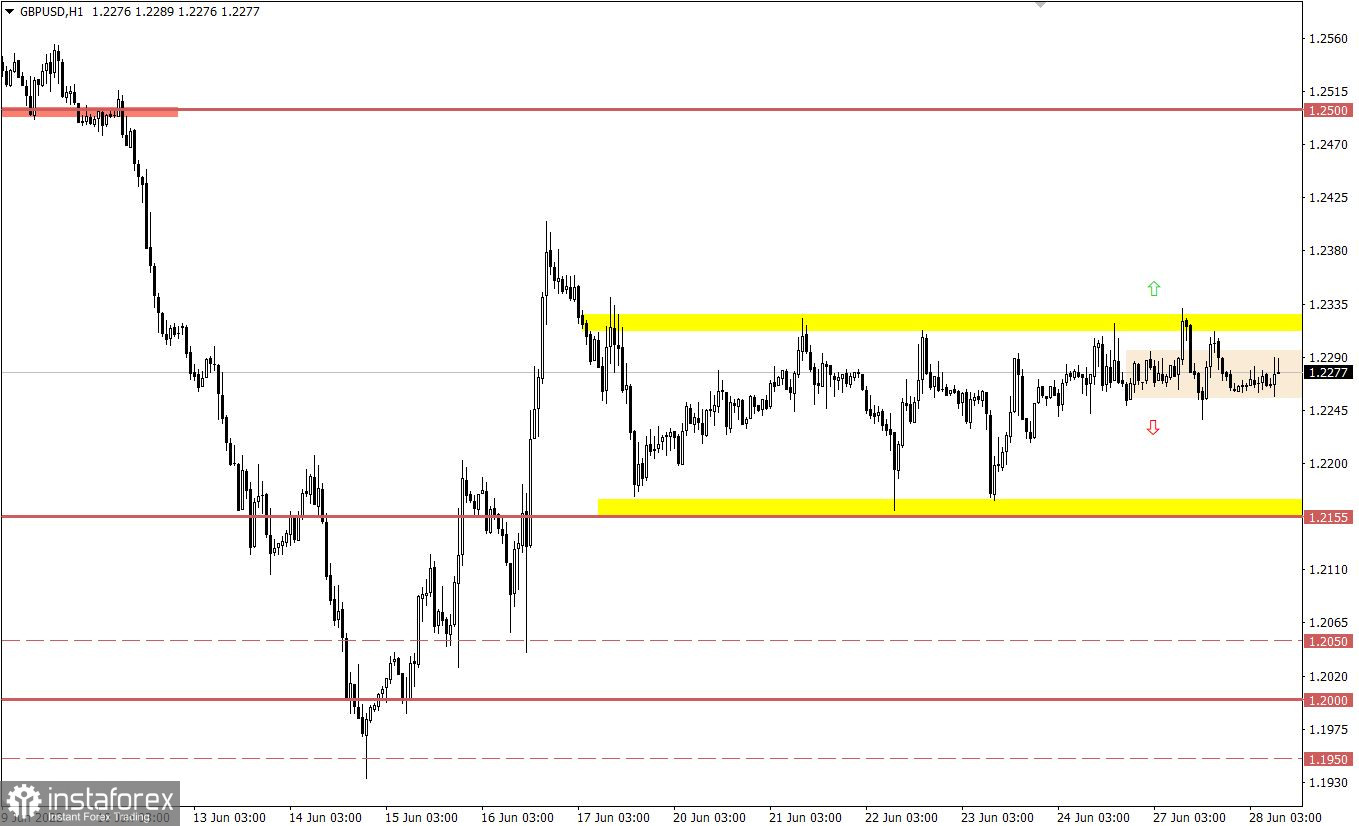
The GBPUSD currency pair has been moving within the upper border of the side channel 1.2150/1.2320 for the second day in a row, which indicates the process of accumulation of trading forces.
Today the macroeconomic calendar is empty, the only thing that can affect the market is political statements during the G7 summit.
The short-term side channel is still relevant in the market, for this reason, traders allow the tactics of working on a price rebound.
An alternative scenario considers a breakout strategy, where holding the price outside of one or another boundary in a four-hour period will indicate a subsequent path.
In this situation, the compression of the amplitude within the current flat serves as a lever that focuses abundant attention on the part of speculators. Thus, the market may soon accelerate, which will lead to one of the possible scenarios:
Price rebound from the upper border of the flat, followed by a move towards the values of 1.2200–1.2150.
The breakdown of the upper border of the flat, where a buy signal will appear if the price holds above 1.2340 in a four-hour period.
A candlestick chart view is graphical rectangles of white and black light, with sticks on top and bottom. When analyzing each candle in detail, you will see its characteristics of a relative period: the opening price, closing price, and maximum and minimum prices.
Horizontal levels are price coordinates, relative to which a stop or a price reversal may occur. These levels are called support and resistance in the market.
Circles and rectangles are highlighted examples where the price of the story unfolded. This color selection indicates horizontal lines that may put pressure on the quote in the future.
The up/down arrows are the reference points of the possible price direction in the future.
*La presente analisi del mercato ha un carattere esclusivamente informativo e non rappresenta una guida per l`effettuazione di una transazione.
Le recensioni analitiche di InstaSpot ti renderanno pienamente consapevole delle tendenze del mercato! Essendo un cliente InstaSpot, ti viene fornito un gran numero di servizi gratuiti per il trading efficiente.


