


Đội ngũ của chúng tôi có hơn 7,000,000 thương nhân!
Hàng ngày chúng tôi làm việc cùng nhau để cải thiện việc giao dịch. Chúng tôi nhận được kết quả cao và luôn tiến lên phía trước.
Sự công nhận của hàng triệu thương nhân trên toàn thế giới là sự đánh giá tốt nhất cho công việc của chúng tôi! Bạn đã đưa ra quyết định của mình và chúng tôi sẽ làm mọi thứ cần thiết để đáp ứng mong đợi của bạn!
Chúng ta cùng với nhau sẽ là một nhóm tuyệt vời!
InstaSpot. Tự hào làm việc cho bạn!


Diễn viên, nhà vô địch mùa giải UFC 6 và là người hùng thật sự!
Người tự mình làm nên tất cả. Người đàn ông đáng kể học hỏi.
Bí mật đằng sau thành công của Taktarov là sự cố gắng liên tục hướng tới mục tiêu.
Hãy khai phá tất cả các mặt tài năng của bạn!
Khám phá, thử, thất bại - nhưng không bao giờ dừng lại!
InstaSpot. Câu chuyện thành công của bạn bắt đầu từ đây!
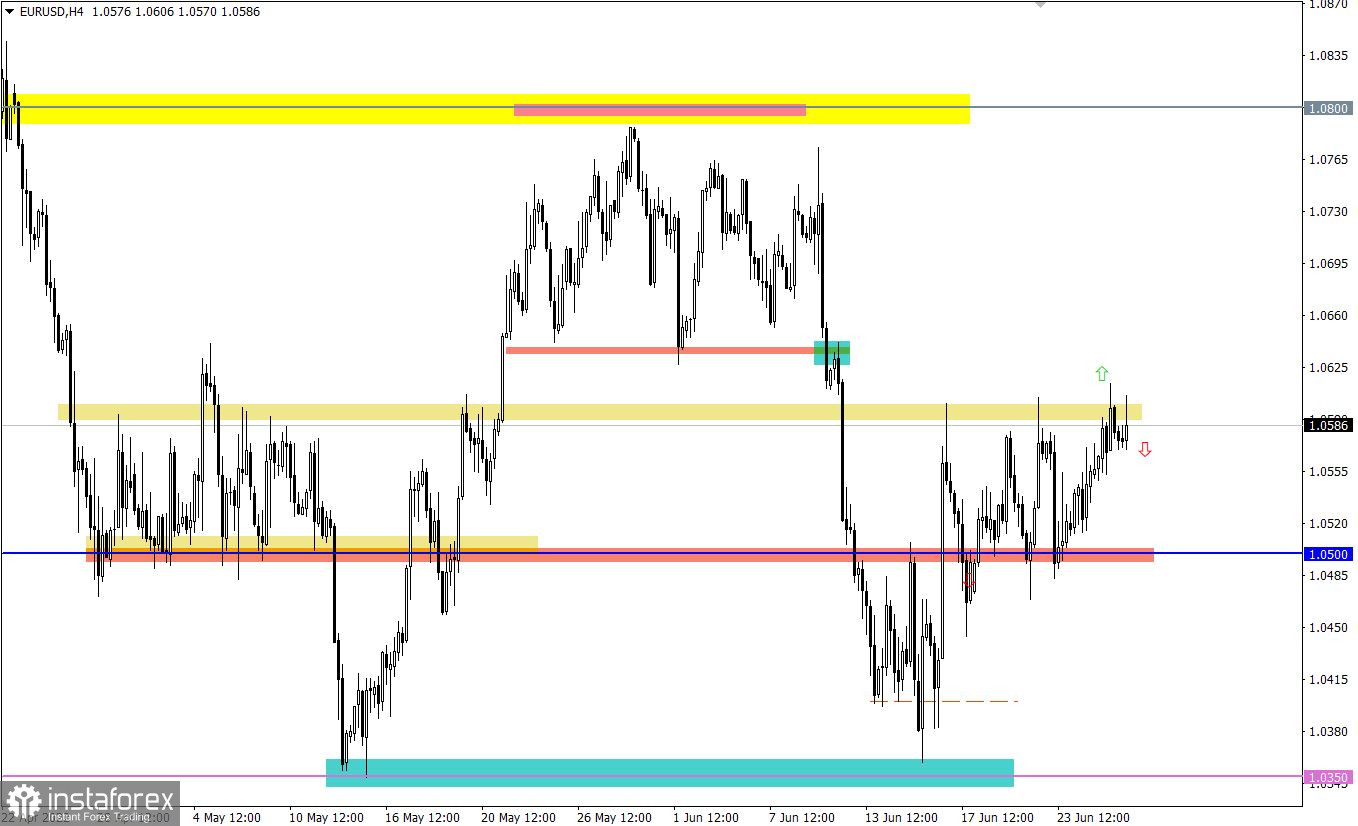
US durable goods orders data surprised traders with a divergence in expectations. Forecasts predicted a decline of 0.3% in May, but actual data showed orders increased by 0.7%.
The EURUSD currency pair slowed down the upward pace after the price approached the upper flat line 1.0500/1.0600. This move led to a reduction in the volume of long positions and, as a result, a pullback.
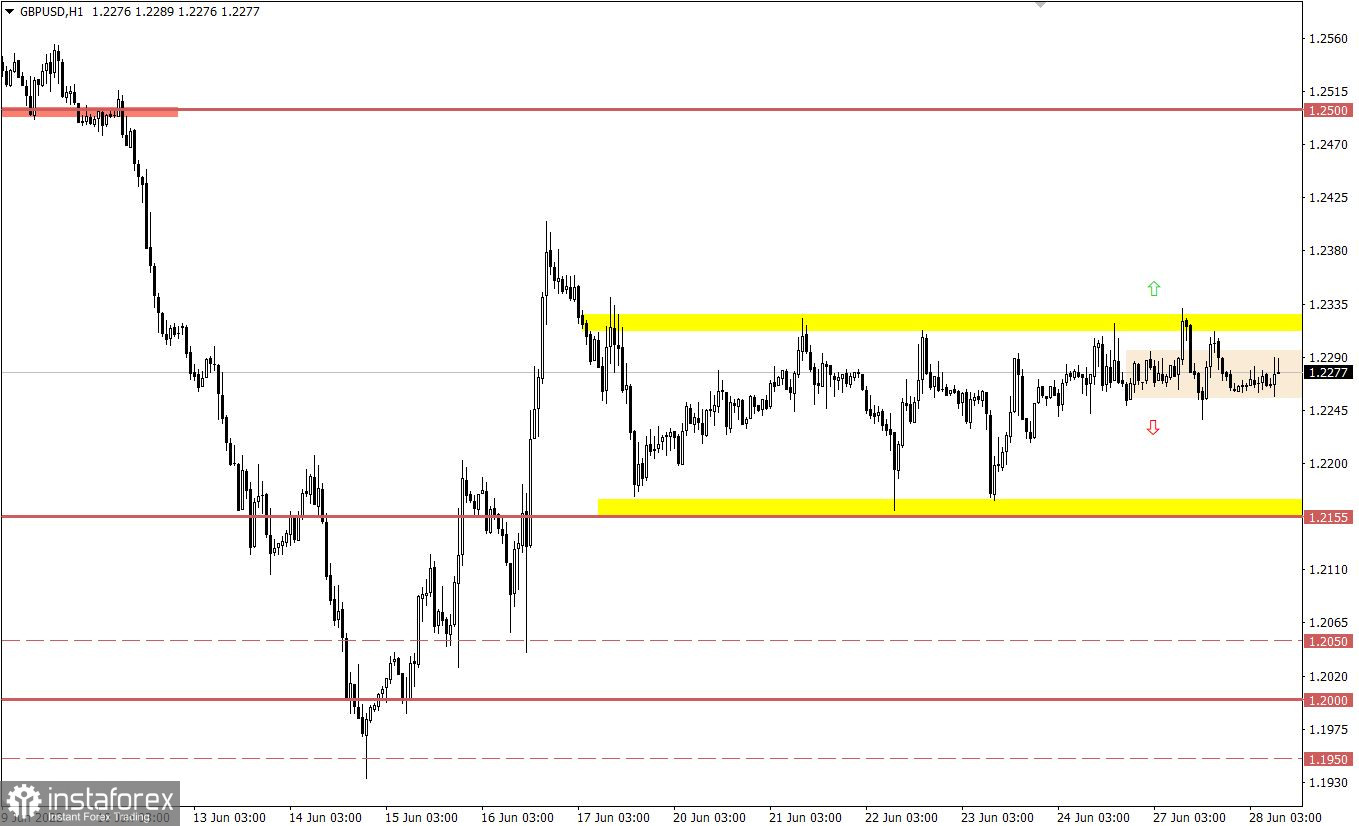
The GBPUSD currency pair has been moving within the upper border of the side channel 1.2150/1.2320 for the second day in a row, which indicates the process of accumulation of trading forces.
Today the macroeconomic calendar is empty, the only thing that can affect the market is political statements during the G7 summit.
The short-term side channel is still relevant in the market, for this reason, traders allow the tactics of working on a price rebound.
An alternative scenario considers a breakout strategy, where holding the price outside of one or another boundary in a four-hour period will indicate a subsequent path.
In this situation, the compression of the amplitude within the current flat serves as a lever that focuses abundant attention on the part of speculators. Thus, the market may soon accelerate, which will lead to one of the possible scenarios:
Price rebound from the upper border of the flat, followed by a move towards the values of 1.2200–1.2150.
The breakdown of the upper border of the flat, where a buy signal will appear if the price holds above 1.2340 in a four-hour period.
A candlestick chart view is graphical rectangles of white and black light, with sticks on top and bottom. When analyzing each candle in detail, you will see its characteristics of a relative period: the opening price, closing price, and maximum and minimum prices.
Horizontal levels are price coordinates, relative to which a stop or a price reversal may occur. These levels are called support and resistance in the market.
Circles and rectangles are highlighted examples where the price of the story unfolded. This color selection indicates horizontal lines that may put pressure on the quote in the future.
The up/down arrows are the reference points of the possible price direction in the future.
*Phân tích thị trường được đăng tải ở đây có nghĩa là để gia tăng nhận thức của bạn, nhưng không đưa ra các chỉ dẫn để thực hiện một giao dịch.
InstaSpot analytical reviews will make you fully aware of market trends! Being an InstaSpot client, you are provided with a large number of free services for efficient trading.


