


Nella nostra squadra ci sono più di 7.000.000 trader! Ogni giorno ci impegniamo a far sì che il trading migliori. Conseguiamo grandi risultati e ci muoviamo in avanti.
Il riconoscimento da parte di milioni di trader in tutto il mondo rappresenta l'alta valutazione della nostra attività! Voi avete fatto la vostra scelta e noi faremo la nostra al fine di soddisfare le vostre aspettative!
Assieme siamo una grande squadra!
InstaSpot. Siamo orgogliosi di lavorare per voi!


Attore, campione del mondo di lotta libera e semplicemente un vero maciste russo! Persona venuta dal nulla. Persona che rispecchia i nostri obiettivi. Il segreto del successo di Taktarov consiste nel mirare continuamente al suo scopo.
Dischiudi anche tu tutti gli aspetti del tuo talento! Impara, prova, sbaglia, ma non fermarti!
InstaSpot - la storia delle tue vittorie inizia qui!

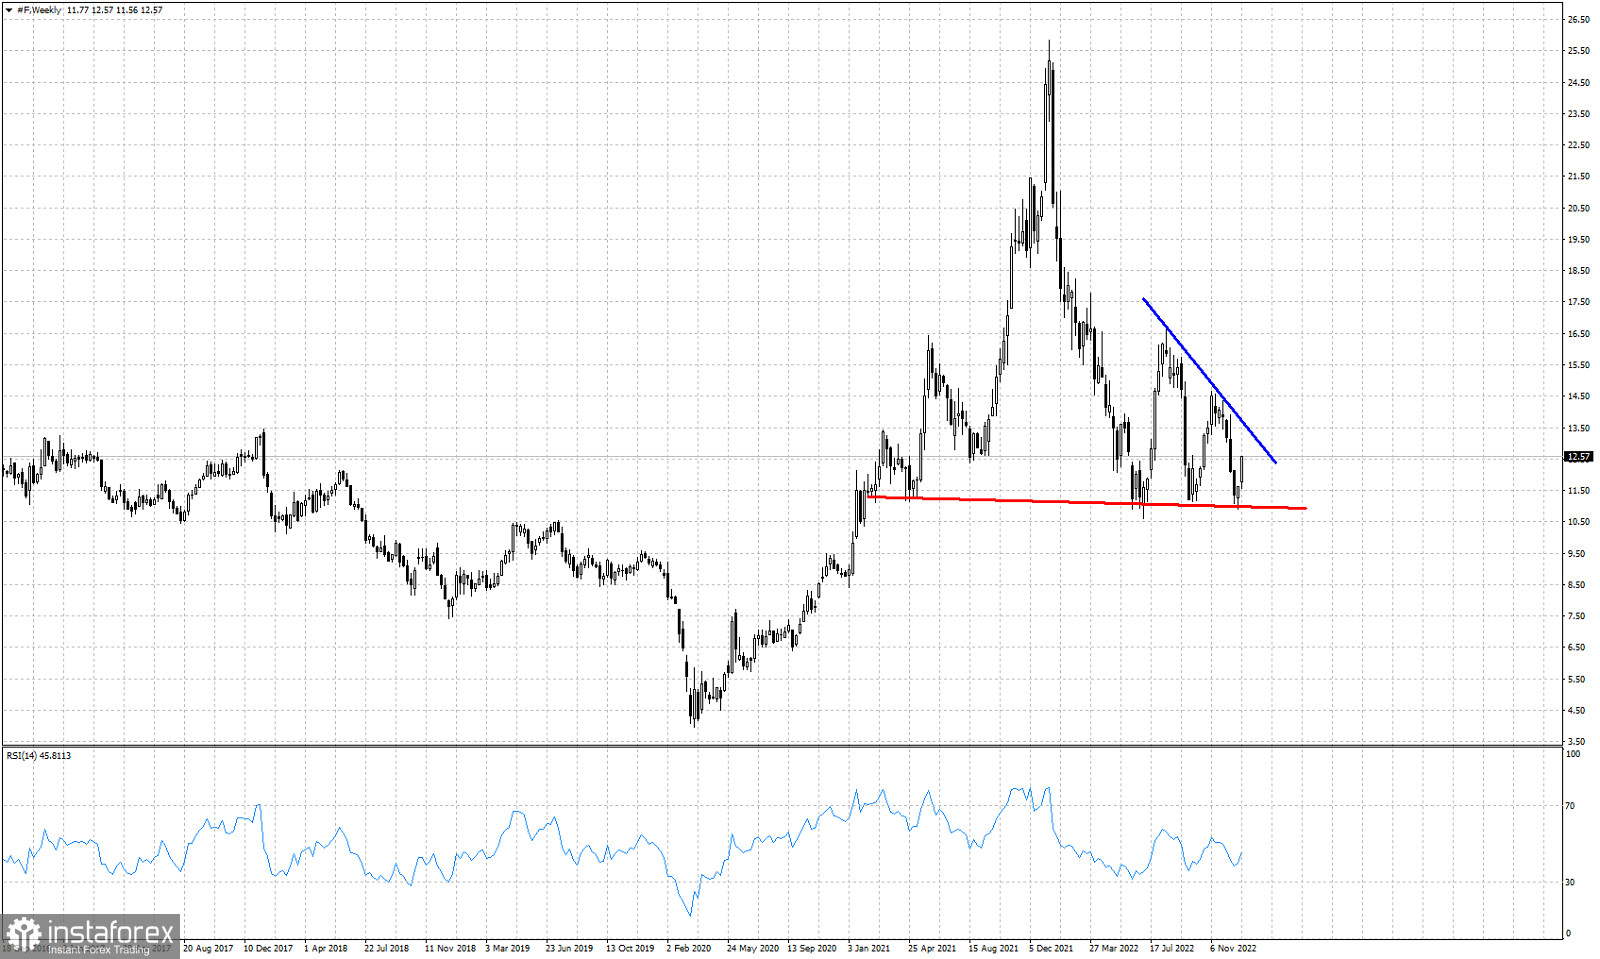
Blue line- resistance trend line
Red line- neckline support
Ford stock price closed last week near its weekly high around $12.57. Price continues to respect the horizontal support neck line at $11 after a third test over the last 10 months. Price has been forming lower highs after each test and bounce. Resistance now is at $13.70. This formation looks more like a bearish Head and Shoulders pattern. For the bearish pattern to provide a bearish signal we need to see price break the red horizontal support. Since support is being respected, bulls continue to have hopes for a move higher. A break above the resistance trend line at $13,70 would be a very positive sign. Currently the most probable outcome would be for price to reach the blue trend line and form another lower high.
*La presente analisi del mercato ha un carattere esclusivamente informativo e non rappresenta una guida per l`effettuazione di una transazione.
Le recensioni analitiche di InstaSpot ti renderanno pienamente consapevole delle tendenze del mercato! Essendo un cliente InstaSpot, ti viene fornito un gran numero di servizi gratuiti per il trading efficiente.


