


我们的团队有超过700万的操盘手!
我们每天都在一起努力改善交易。我们得到了很高的成绩,并继续前进。
世界各地数以百万计的操盘手的认可是我们工作的最大赞赏! 您做出了您的选择,我们将尽一切努力来满足您的期望!
我们是一个共同的伟大团队!
InstaSpot. 自豪地为您工作!


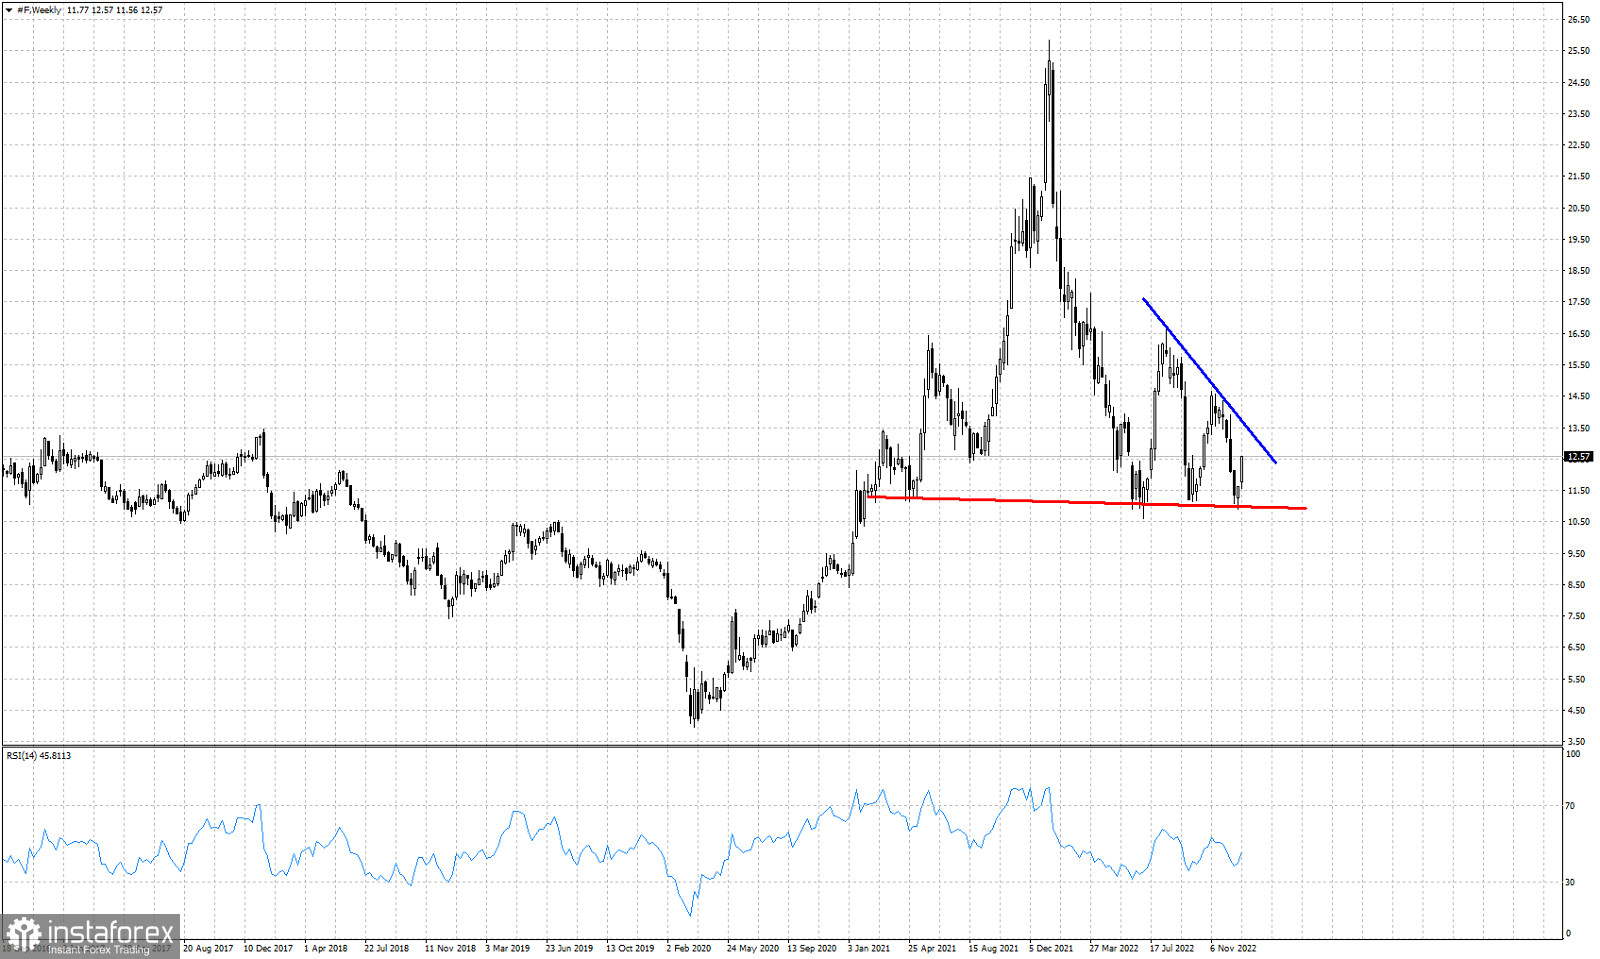
Blue line- resistance trend line
Red line- neckline support
Ford stock price closed last week near its weekly high around $12.57. Price continues to respect the horizontal support neck line at $11 after a third test over the last 10 months. Price has been forming lower highs after each test and bounce. Resistance now is at $13.70. This formation looks more like a bearish Head and Shoulders pattern. For the bearish pattern to provide a bearish signal we need to see price break the red horizontal support. Since support is being respected, bulls continue to have hopes for a move higher. A break above the resistance trend line at $13,70 would be a very positive sign. Currently the most probable outcome would be for price to reach the blue trend line and form another lower high.
*这里的市场分析是为了增加您对市场的了解,而不是给出交易的指示。
InstaSpot分析评论将让您充分了解市场趋势! 作为InstaSpot的客户,您将获得大量的免费服务以实现有效的交易。


