


Nella nostra squadra ci sono più di 7.000.000 trader! Ogni giorno ci impegniamo a far sì che il trading migliori. Conseguiamo grandi risultati e ci muoviamo in avanti.
Il riconoscimento da parte di milioni di trader in tutto il mondo rappresenta l'alta valutazione della nostra attività! Voi avete fatto la vostra scelta e noi faremo la nostra al fine di soddisfare le vostre aspettative!
Assieme siamo una grande squadra!
InstaSpot. Siamo orgogliosi di lavorare per voi!


Attore, campione del mondo di lotta libera e semplicemente un vero maciste russo! Persona venuta dal nulla. Persona che rispecchia i nostri obiettivi. Il segreto del successo di Taktarov consiste nel mirare continuamente al suo scopo.
Dischiudi anche tu tutti gli aspetti del tuo talento! Impara, prova, sbaglia, ma non fermarti!
InstaSpot - la storia delle tue vittorie inizia qui!

Last week ended with an empty macroeconomic calendar. The only thing that speculators could pay attention to was the new package of European Union sanctions against the Russian Federation.
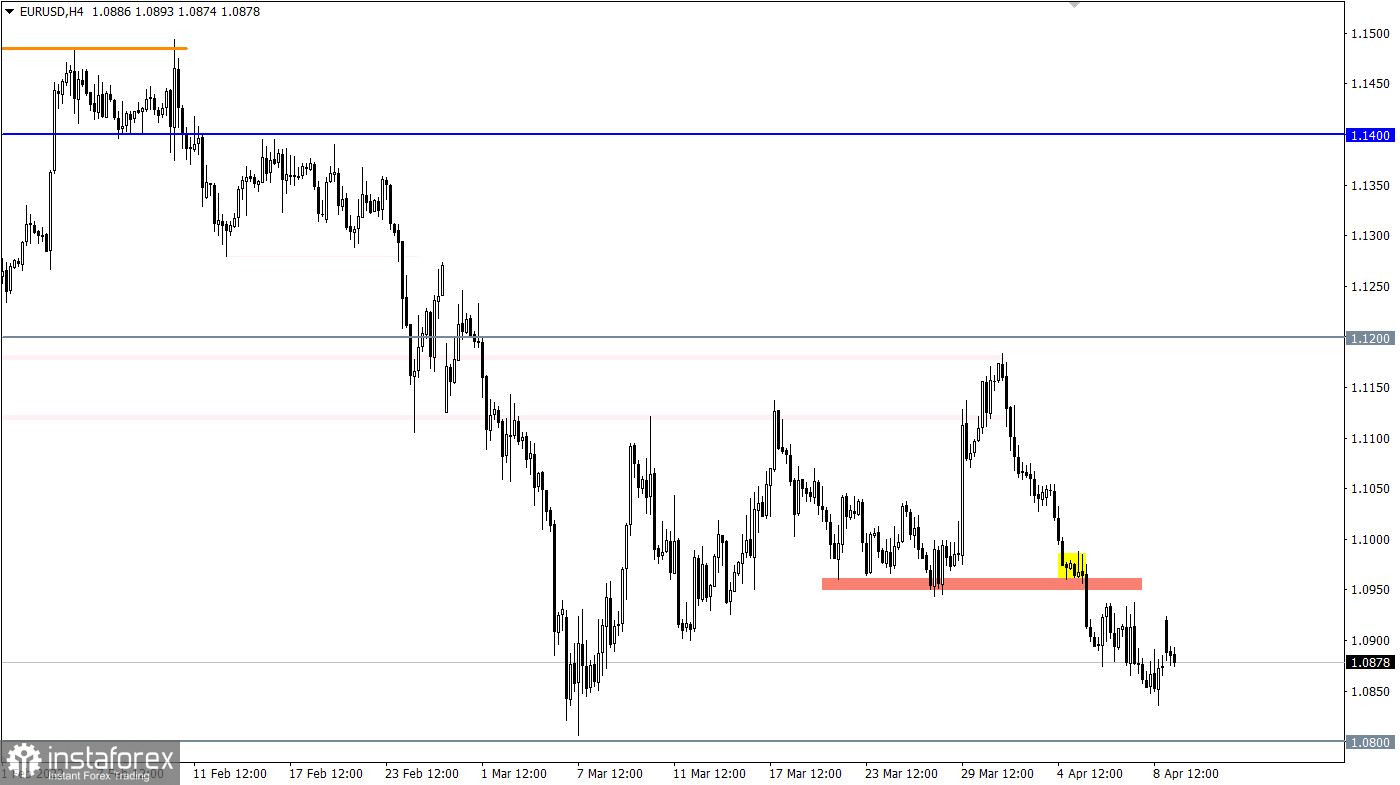
During the intensive downward movement, the EURUSD currency pair has almost reached the support level of 1.0800, where the medium-term trend slowed down earlier. Recovery of dollar positions relative to the recent correction amounted to 91%. Traders are already on the verge of a trend prolongation.
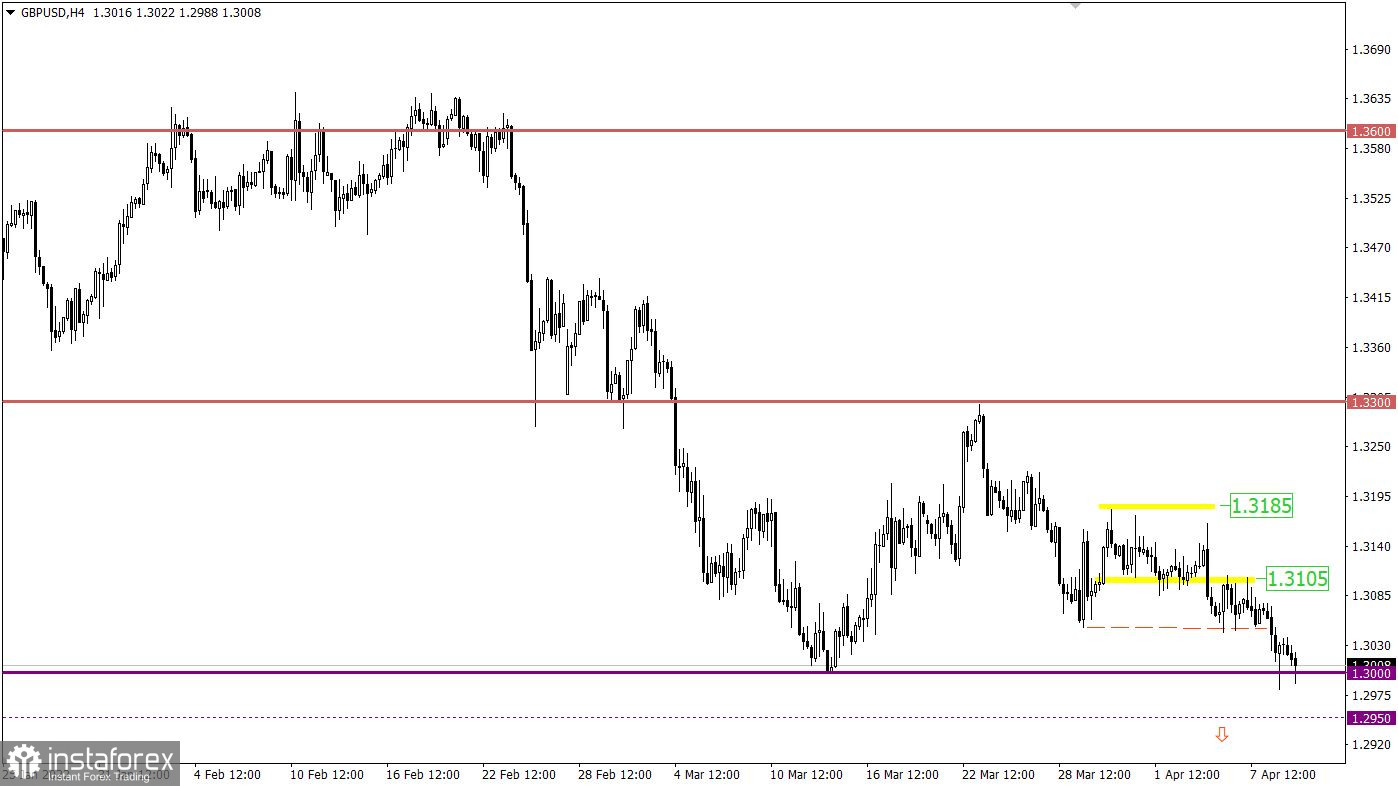
During the downward movement, the GBPUSD currency pair reached the psychological level of 1.3000, which previously served as support. This step indicates a high interest of traders in short positions, which in the future will accelerate the downward course.
On the trading chart of the daily period, there is a complete recovery of dollar positions relative to the corrective move.

The macroeconomic calendar is usually empty on Mondays, but not this time. During the European session, data on industrial production in the UK was published. The February data showed a decrease from 3.0% to 1.6%. Consequently, the situation will only worsen as the results of the March data suggest that a decline in industrial production will be recorded.
Current indicators put pressure on the British currency.
In this situation, a signal about the prolongation of the downward trend will come from the market at the moment the price is kept below the support level of 1.0800 in a four-hour period. Until then, a variable price fluctuation within the pivot point is possible.
A signal about the prolongation of the medium-term downward trend will come from the market at the moment the price is kept below the value of 1.2950 for at least a four-hour period. Until then, the risk of a price rebound from the 1.3000 support level remains, which will lead to a local pullback.
A candlestick chart view is graphical rectangles of white and black light, with sticks on top and bottom. When analyzing each candle in detail, you will see its characteristics of a relative period: the opening price, closing price, and maximum and minimum prices.
Horizontal levels are price coordinates, relative to which a stop or a price reversal may occur. These levels are called support and resistance in the market.
Circles and rectangles are highlighted examples where the price of the story unfolded. This color selection indicates horizontal lines that may put pressure on the quote in the future.
The up/down arrows are the reference points of the possible price direction in the future.
*La presente analisi del mercato ha un carattere esclusivamente informativo e non rappresenta una guida per l`effettuazione di una transazione.
Le recensioni analitiche di InstaSpot ti renderanno pienamente consapevole delle tendenze del mercato! Essendo un cliente InstaSpot, ti viene fornito un gran numero di servizi gratuiti per il trading efficiente.


