


Huyền thoại trong nhóm InstaSpot!
Huyền thoại! Bạn nghĩ rằng đó là lời nói khoa trương? Nhưng chúng ta nên gọi một người đàn ông như thế nào, người đã trở thành người châu Á đầu tiên giành chức vô địch cờ vua thế giới lứa tuổi thiếu niên năm 18 tuổi và người trở thành Đại kiện tướng Ấn Độ đầu tiên năm 19 tuổi? Đó là khởi đầu cho con đường khó khăn đến danh hiệu Vô địch Thế giới của Viswanathan Anand, người đàn ông đã trở thành một phần của lịch sử cờ vua mãi mãi. Giờ đây, một huyền thoại nữa trong nhóm InstaSpot!


Borussia là một trong những câu lạc bộ bóng đá danh giá nhất nước Đức, đã nhiều lần chứng minh cho người hâm mộ thấy: tinh thần thi đấu và sự lãnh đạo chắc chắn sẽ dẫn đến thành công. Giao dịch theo cách mà các chuyên gia thể thao chơi trò chơi: tự tin và chủ động. Giữ một "đường chuyền" từ Borussia FC và dẫn đầu với InstaSpot!
Last week ended with an empty macroeconomic calendar. The only thing that speculators could pay attention to was the new package of European Union sanctions against the Russian Federation.
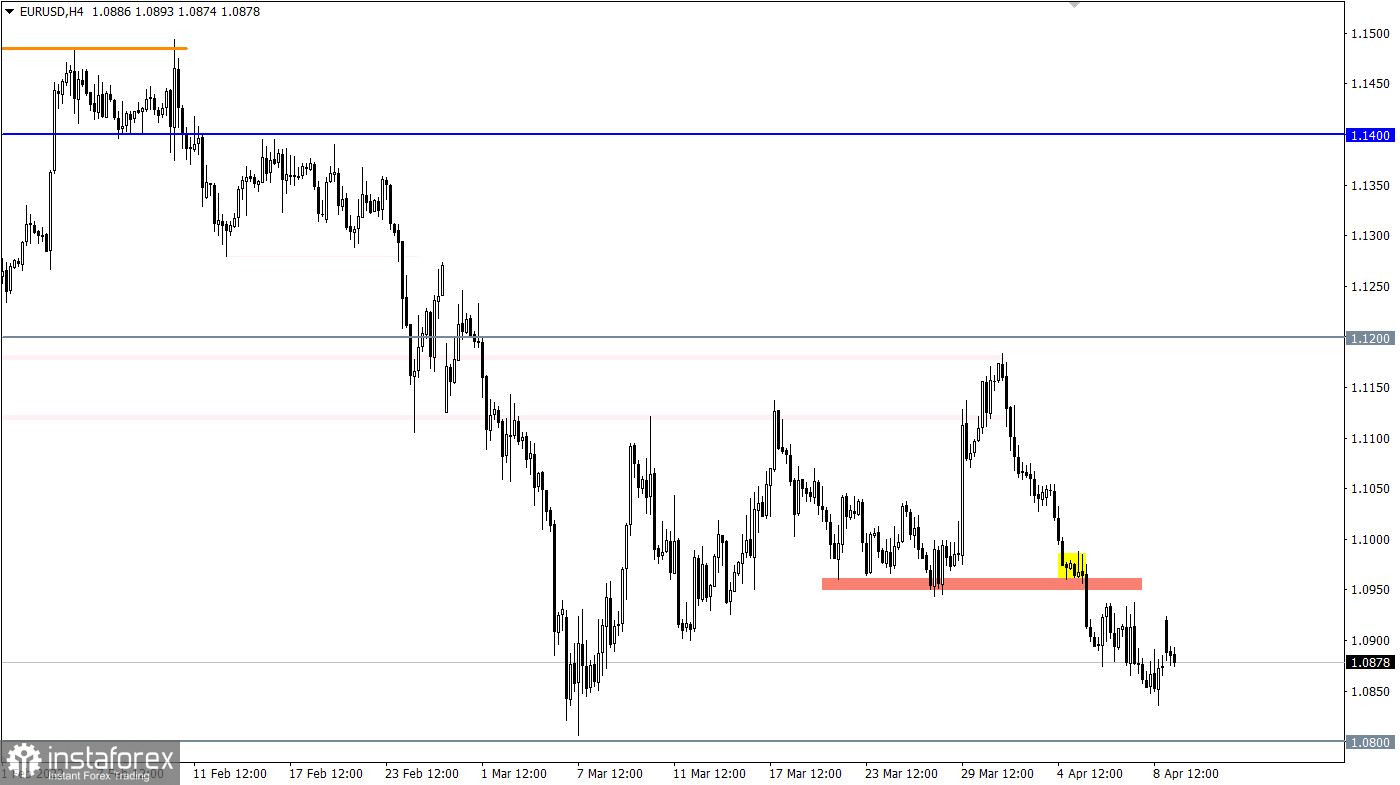
During the intensive downward movement, the EURUSD currency pair has almost reached the support level of 1.0800, where the medium-term trend slowed down earlier. Recovery of dollar positions relative to the recent correction amounted to 91%. Traders are already on the verge of a trend prolongation.
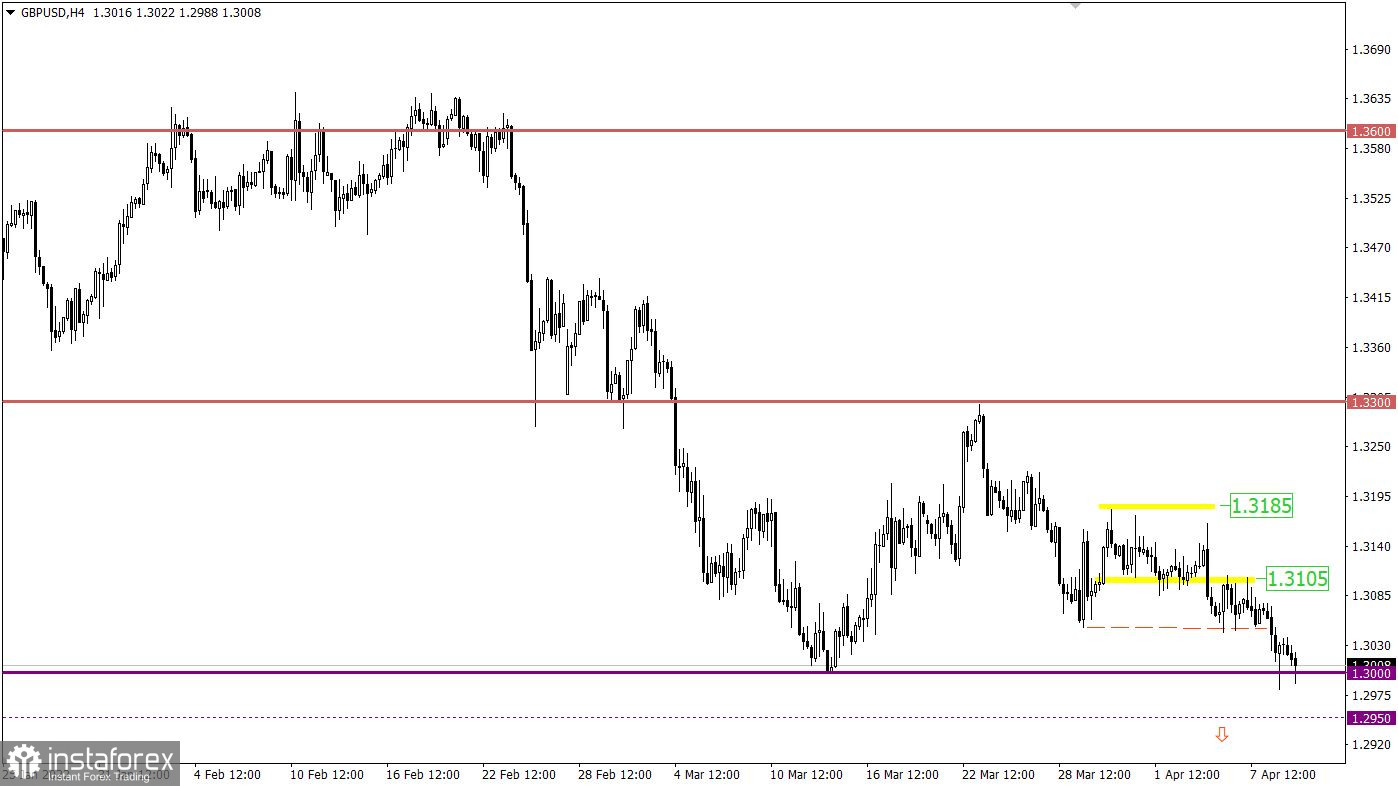
During the downward movement, the GBPUSD currency pair reached the psychological level of 1.3000, which previously served as support. This step indicates a high interest of traders in short positions, which in the future will accelerate the downward course.
On the trading chart of the daily period, there is a complete recovery of dollar positions relative to the corrective move.

The macroeconomic calendar is usually empty on Mondays, but not this time. During the European session, data on industrial production in the UK was published. The February data showed a decrease from 3.0% to 1.6%. Consequently, the situation will only worsen as the results of the March data suggest that a decline in industrial production will be recorded.
Current indicators put pressure on the British currency.
In this situation, a signal about the prolongation of the downward trend will come from the market at the moment the price is kept below the support level of 1.0800 in a four-hour period. Until then, a variable price fluctuation within the pivot point is possible.
A signal about the prolongation of the medium-term downward trend will come from the market at the moment the price is kept below the value of 1.2950 for at least a four-hour period. Until then, the risk of a price rebound from the 1.3000 support level remains, which will lead to a local pullback.
A candlestick chart view is graphical rectangles of white and black light, with sticks on top and bottom. When analyzing each candle in detail, you will see its characteristics of a relative period: the opening price, closing price, and maximum and minimum prices.
Horizontal levels are price coordinates, relative to which a stop or a price reversal may occur. These levels are called support and resistance in the market.
Circles and rectangles are highlighted examples where the price of the story unfolded. This color selection indicates horizontal lines that may put pressure on the quote in the future.
The up/down arrows are the reference points of the possible price direction in the future.
*Phân tích thị trường được đăng tải ở đây có nghĩa là để gia tăng nhận thức của bạn, nhưng không đưa ra các chỉ dẫn để thực hiện một giao dịch.
InstaSpot analytical reviews will make you fully aware of market trends! Being an InstaSpot client, you are provided with a large number of free services for efficient trading.


