


Nella nostra squadra ci sono più di 7.000.000 trader! Ogni giorno ci impegniamo a far sì che il trading migliori. Conseguiamo grandi risultati e ci muoviamo in avanti.
Il riconoscimento da parte di milioni di trader in tutto il mondo rappresenta l'alta valutazione della nostra attività! Voi avete fatto la vostra scelta e noi faremo la nostra al fine di soddisfare le vostre aspettative!
Assieme siamo una grande squadra!
InstaSpot. Siamo orgogliosi di lavorare per voi!


Attore, campione del mondo di lotta libera e semplicemente un vero maciste russo! Persona venuta dal nulla. Persona che rispecchia i nostri obiettivi. Il segreto del successo di Taktarov consiste nel mirare continuamente al suo scopo.
Dischiudi anche tu tutti gli aspetti del tuo talento! Impara, prova, sbaglia, ma non fermarti!
InstaSpot - la storia delle tue vittorie inizia qui!

The first FOMC meeting in 2022 ended with the interest rate remaining at the same level. This was not something surprising for the markets, as they expected such a step from the regulator. Therefore, special attention was paid not to the results of the meeting, but to the press conference with the Fed Chairman, Jerome Powell.
The main theses of the Fed:
After the results of the meeting at 19:00 Universal time, the market did not hear anything new. There was joy at first, the indices rose. But as soon as Jerome Powell came out with a speech, the speculative hype subsided, and the stock indexes sharply fell. The currency market was timider in its actions, but the US dollar strengthened against its competitors without unnecessary hesitation.
Analysis of trading charts from January 26:
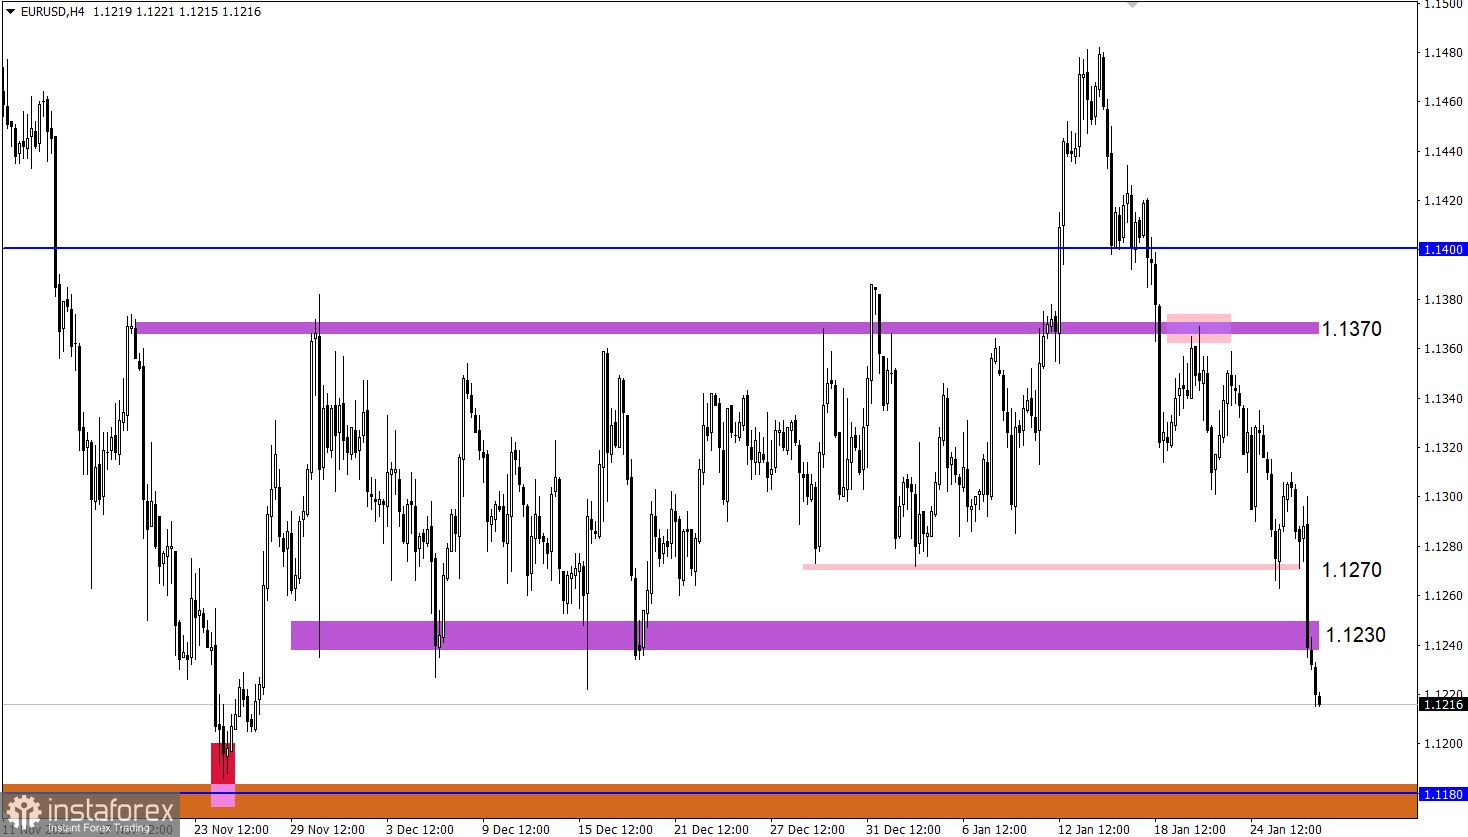
The EUR/USD pair fell below the level of 1.1222 for the first time since November last year. This means that the correction has been completed in the market. Traders are now focused on the prolongation of the downward trend from June 2021.
In this situation, it should be considered that speculative interest prevails, so the signals about the euro being oversold can be ignored by traders.
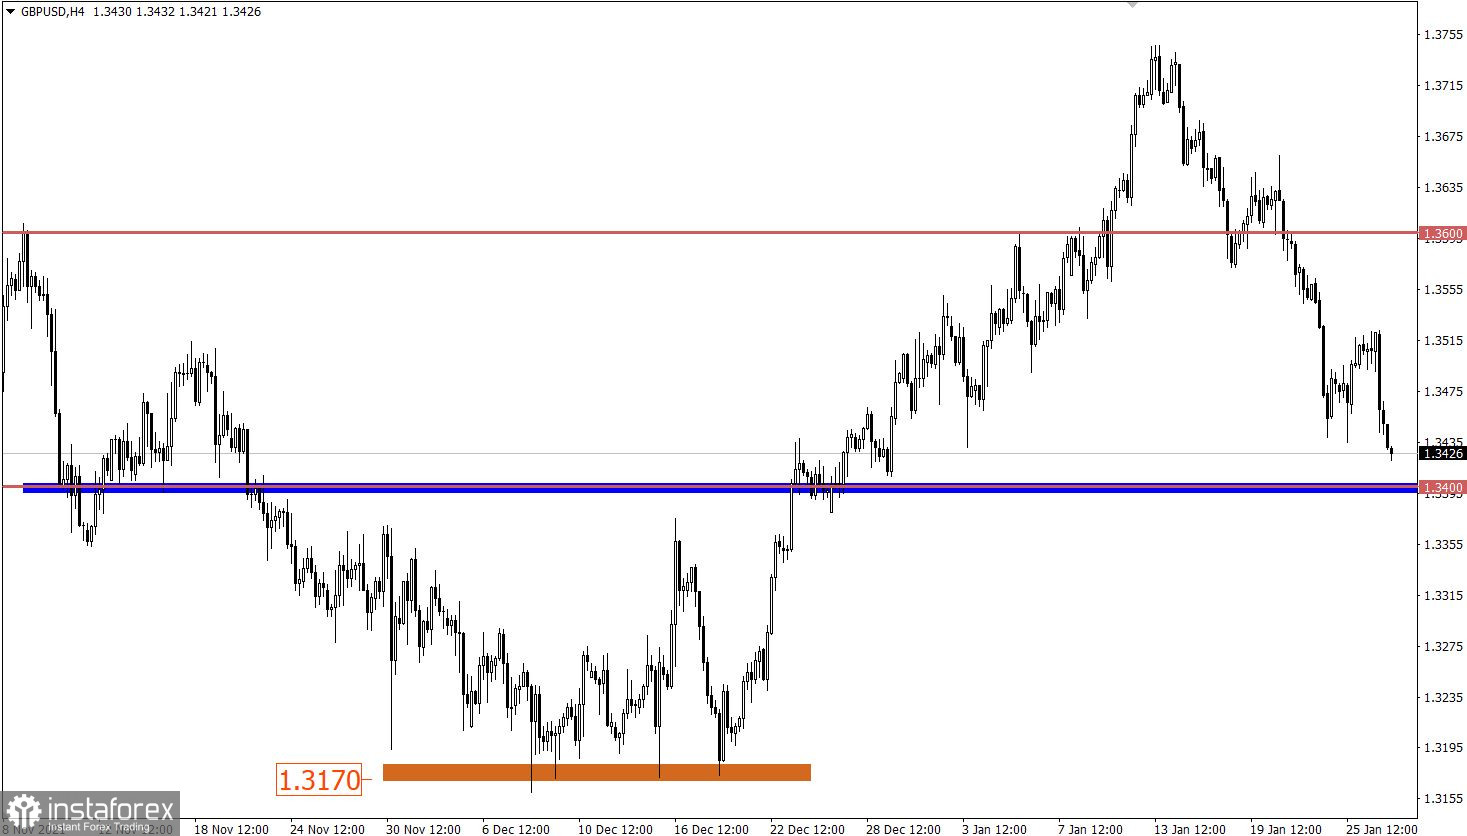
The GBP/USD pair resumed its decline after a slight pullback. This led to an update of the local low of January 25, opening up the opportunity for traders to recover the US dollar later.
January 27 economic calendar:
Several US data will be published today at 13:30 Universal time, which will certainly affect the market.
The publication of preliminary GDP data for the fourth quarter is expected, where they predict an increase in the pace of the economy from 2.3% to 5.5%.
Meanwhile, the volume of applications for unemployment benefits will not change much:
The overall figure is 11 thousand, which is considered a minor change.
At the same time, orders for durable goods for December may decline by 0.2%, which is not considered good for the economy.
As a result, only GDP data can stimulate the US dollar's growth.
Trading plan for EUR/USD on January 27:
Despite technical signals of a slowdown in the downward trend, speculative hype continues to increase the volume of short positions in the euro. This may lead to a prolongation of the inertial course towards the local low (1.1186) of November 24. A technical pullback is possible in this area.
Trading plan for GBP/USD on January 27:
In this situation, traders are considering the subsequent recovery of downward interest in the market. It is possible to strengthen short positions after holding the price below the level of 1.3400 in the daily chart. This step may open the way for sellers towards the levels of 1.3320 and 1.3200.
What is reflected in the trading charts?
A candlestick chart view is graphical rectangles of white and black light, with sticks on top and bottom. When analyzing each candle in detail, you will see its characteristics of a relative period: the opening price, closing price, and maximum and minimum prices.
Horizontal levels are price coordinates, relative to which a stop or a price reversal may occur. These levels are called support and resistance in the market.
Circles and rectangles are highlighted examples where the price of the story unfolded. This color selection indicates horizontal lines that may put pressure on the quote in the future.
The up/down arrows are the reference points of the possible price direction in the future.
*La presente analisi del mercato ha un carattere esclusivamente informativo e non rappresenta una guida per l`effettuazione di una transazione.
Le recensioni analitiche di InstaSpot ti renderanno pienamente consapevole delle tendenze del mercato! Essendo un cliente InstaSpot, ti viene fornito un gran numero di servizi gratuiti per il trading efficiente.


