


Legenda tim InstaSpot!
Legenda! Anda pikir legenda adalah retorika yang bombastis? Lalu, bagaimana menyebut seorang pria, seorang Asia pertama yang memenangkan kejuaraan catur dunia junior pada usia 18 tahun, dan yang menjadi Grandmaster India pertama pada usia 19 tahun? Itulah awal perjalanan yang sulit dalam meraih gelar Juara Dunia bagi Viswanathan Anand, pria yang menjadi bagian dari sejarah catur untuk selamanya. Sekarang, satu lagi legenda masuk ke dalam tim InstaSpot!


Borussia merupakan salah satu klub sepakbola paling terkenal di Jerman, yang telah berulang kali membuktikan pada para penggemarnya: semangat kompetisi dan kepemimpinan pasti akan mengarah pada kesuksesan. Lakukan trading dengan cara yang sama seperti para profesional olahraga: percaya diri dan aktif. Gunakan "kunci" dari Borussia FC dan jadilah yang terdepan bersama InstaSpot!

The first FOMC meeting in 2022 ended with the interest rate remaining at the same level. This was not something surprising for the markets, as they expected such a step from the regulator. Therefore, special attention was paid not to the results of the meeting, but to the press conference with the Fed Chairman, Jerome Powell.
The main theses of the Fed:
After the results of the meeting at 19:00 Universal time, the market did not hear anything new. There was joy at first, the indices rose. But as soon as Jerome Powell came out with a speech, the speculative hype subsided, and the stock indexes sharply fell. The currency market was timider in its actions, but the US dollar strengthened against its competitors without unnecessary hesitation.
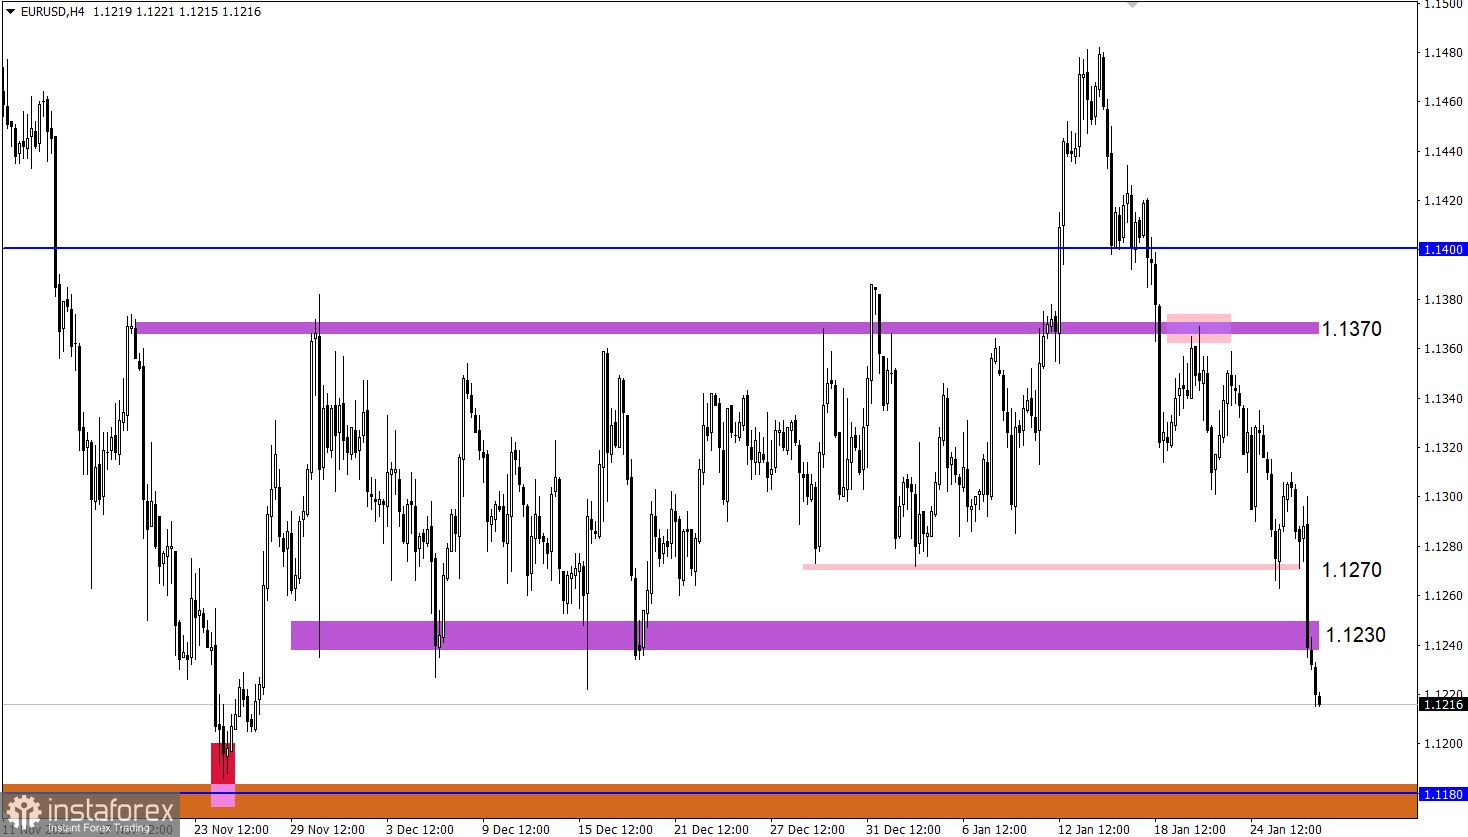
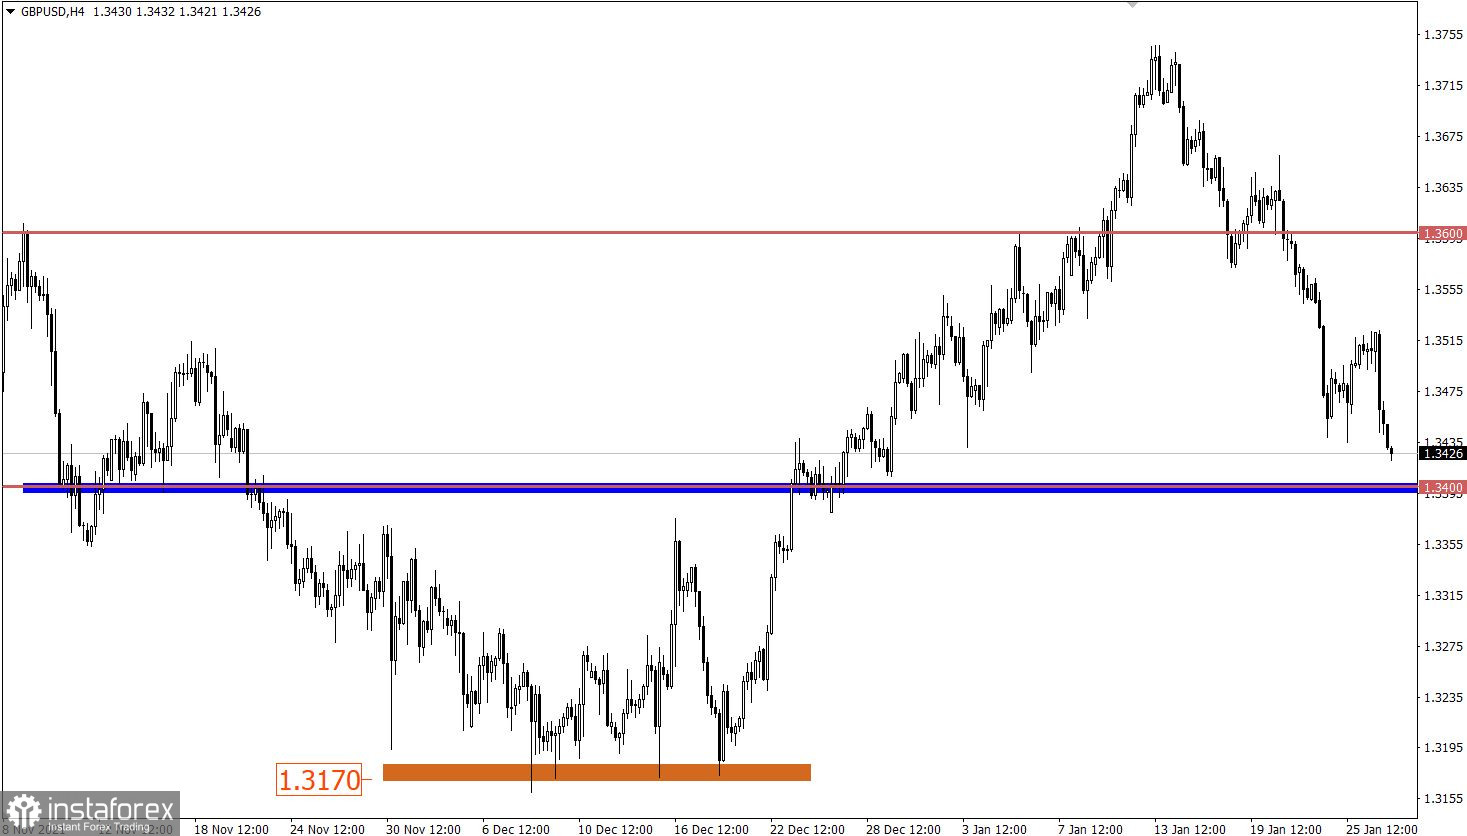
Analysis of trading charts from January 26:
The EUR/USD pair fell below the level of 1.1222 for the first time since November last year. This means that the correction has been completed in the market. Traders are now focused on the prolongation of the downward trend from June 2021.
In this situation, it should be considered that speculative interest prevails, so the signals about the euro being oversold can be ignored by traders.
The GBP/USD pair resumed its decline after a slight pullback. This led to an update of the local low of January 25, opening up the opportunity for traders to recover the US dollar later.
January 27 economic calendar:
Several US data will be published today at 13:30 Universal time, which will certainly affect the market.
The publication of preliminary GDP data for the fourth quarter is expected, where they predict an increase in the pace of the economy from 2.3% to 5.5%.
Meanwhile, the volume of applications for unemployment benefits will not change much:
The overall figure is 11 thousand, which is considered a minor change.
At the same time, orders for durable goods for December may decline by 0.2%, which is not considered good for the economy.
As a result, only GDP data can stimulate the US dollar's growth.
Trading plan for EUR/USD on January 27:
Despite technical signals of a slowdown in the downward trend, speculative hype continues to increase the volume of short positions in the euro. This may lead to a prolongation of the inertial course towards the local low (1.1186) of November 24. A technical pullback is possible in this area.
Trading plan for GBP/USD on January 27:
In this situation, traders are considering the subsequent recovery of downward interest in the market. It is possible to strengthen short positions after holding the price below the level of 1.3400 in the daily chart. This step may open the way for sellers towards the levels of 1.3320 and 1.3200.
What is reflected in the trading charts?
A candlestick chart view is graphical rectangles of white and black light, with sticks on top and bottom. When analyzing each candle in detail, you will see its characteristics of a relative period: the opening price, closing price, and maximum and minimum prices.
Horizontal levels are price coordinates, relative to which a stop or a price reversal may occur. These levels are called support and resistance in the market.
Circles and rectangles are highlighted examples where the price of the story unfolded. This color selection indicates horizontal lines that may put pressure on the quote in the future.
The up/down arrows are the reference points of the possible price direction in the future.
*Analisis pasar yang diposting disini dimaksudkan untuk meningkatkan pengetahuan Anda namun tidak untuk memberi instruksi trading.
Tinjauan analitis InstaSpot akan membuat Anda menyadari sepenuhnya tren pasar! Sebagai klien InstaSpot, Anda dilengkapi dengan sejumlah besar layanan gratis untuk trading yang efisien.


