


Il y a maintenant plus de 7 millions de traders dans notre équipe! Chaque jour nous travaillons à améliorer le trading. On s'efforce de vous offrir le meilleur et on obtient les plus beaux succès.
La confiance de millions de traders partout dans le monde est l'évaluation la plus élevée de notre travail!
Vous avez fait votre choix et nous allons faire de notre mieux pour répondre à vos attentes!
Ensemble, nous faisons une super équipe!
InstaSpot est fier de vous servir!


L'acteur, le champion de l'UFC et un vrai bogatyr russe! . Homme qui ne doit sa réussite qu'à lui-même. L'homme qui est sur la même route que nous suivons.
Le secret du succès de Taktarov est le progrès permanent vers la réalisation de son objectif.
Découvrez toutes les facettes de votre talent! Apprenez, essayez, commettez des erreurs, mais ne vous arrêtez pas!
InstaSpot - L'histoire de votre succès commence ici !
U.S. industrial production rose 0.4% in March after rising 0.2% in February (revised up from 0%). This figure exceeded market forecasts by a modest 0.2%.
The divergence of expectations played in favor of the U.S. dollar.
Simultaneously with industrial production, data on retail sales in the United States were published, where figures for March decreased more than expected. According to the U.S. Department of Commerce, retail sales decreased by 1.0% last month. At the same time, the data for February were revised and showed a decline of 0.2%, not 0.4%, as previously reported. Economists polled by Reuters had forecast a 0.4% decline in sales. There was a 2.9% year-on-year increase in sales in March.
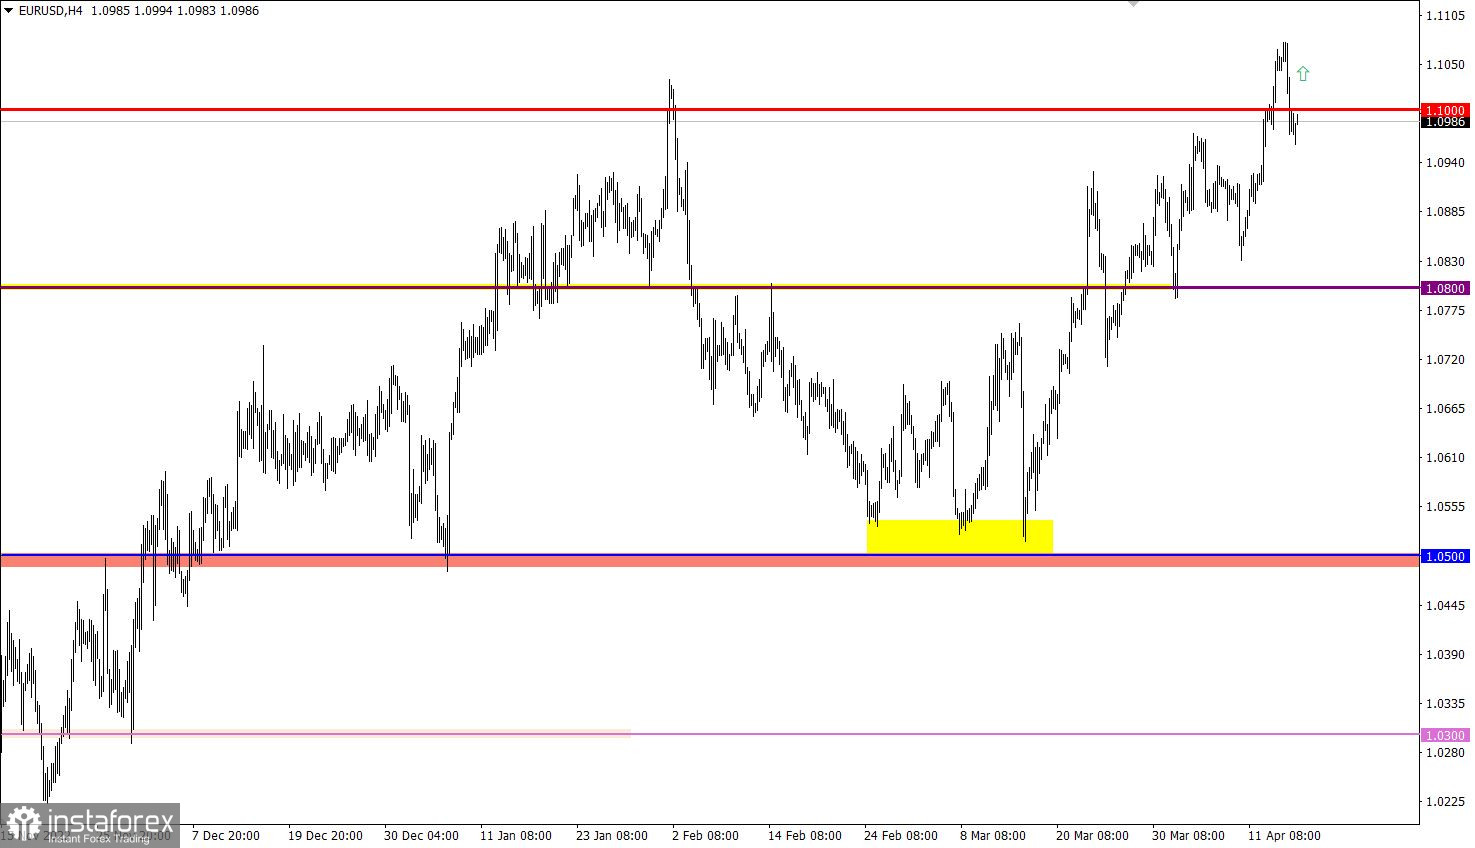
EUR/USD was in an upward inertia for almost the entire past week. As a result, the local high of the medium-term trend was updated. Due to the obvious technical signal of the euro's overbought rate, a pullback occurred during the intraday period, which returned the quote to the 1.1000 level.
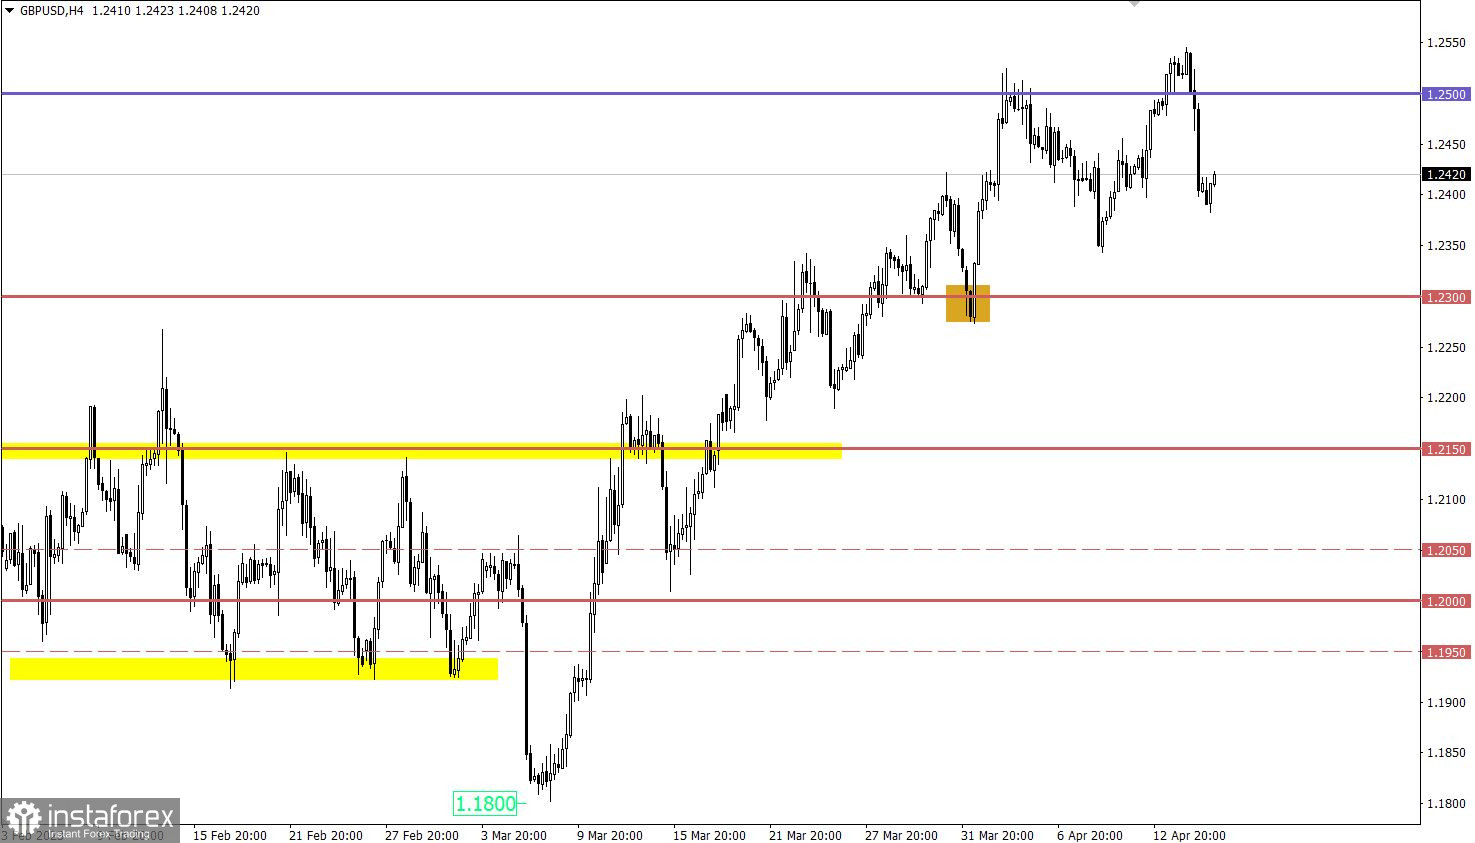
GBP/USD moved into the pullback stage after briefly holding the price above the 1.2500 level. Despite local manifestations of sellers' activity, there is still a medium-term upward trend in the market.
The economic calendar is traditionally empty on Monday. No important reports are expected in the EU, the United Kingdom, and the Unites States.
In this regard, investors and traders intend to focus on the incoming information and news flow. For example, today, representatives of the ECB will give a speech at 09:00 and 15:00 UTC.
It can be assumed that the pullback stage slowed down the formation in the area of the psychological level. This may lead to temporary stagnation, but if the quote goes above the 1.1050 mark, a new round of growth in the volume of long positions may occur. As for the pullback prolongation, a price retention below 1.0950 over a four-hour period is necessary for this signal to occur.
It can be assumed that the price returning to the 1.2500 level may lead to a new wave of growth in long positions, allowing for a prolongation of the medium-term trend. As for the pullback, there are assumptions that it is nearing completion, which may lead to temporary stagnation.
The candlestick chart type is white and black graphic rectangles with lines above and below. With a detailed analysis of each individual candle, you can see its characteristics relative to a particular time frame: opening price, closing price, intraday high and low.
Horizontal levels are price coordinates, relative to which a price may stop or reverse its trajectory. In the market, these levels are called support and resistance.
Circles and rectangles are highlighted examples where the price reversed in history. This color highlighting indicates horizontal lines that may put pressure on the asset's price in the future.
The up/down arrows are landmarks of the possible price direction in the future.
*The market analysis posted here is meant to increase your awareness, but not to give instructions to make a trade.
InstaSpot analytical reviews will make you fully aware of market trends! Being an InstaSpot client, you are provided with a large number of free services for efficient trading.


