


我们的团队有超过700万的操盘手!
我们每天都在一起努力改善交易。我们得到了很高的成绩,并继续前进。
世界各地数以百万计的操盘手的认可是我们工作的最大赞赏! 您做出了您的选择,我们将尽一切努力来满足您的期望!
我们是一个共同的伟大团队!
InstaSpot. 自豪地为您工作!


U.S. industrial production rose 0.4% in March after rising 0.2% in February (revised up from 0%). This figure exceeded market forecasts by a modest 0.2%.
The divergence of expectations played in favor of the U.S. dollar.
Simultaneously with industrial production, data on retail sales in the United States were published, where figures for March decreased more than expected. According to the U.S. Department of Commerce, retail sales decreased by 1.0% last month. At the same time, the data for February were revised and showed a decline of 0.2%, not 0.4%, as previously reported. Economists polled by Reuters had forecast a 0.4% decline in sales. There was a 2.9% year-on-year increase in sales in March.

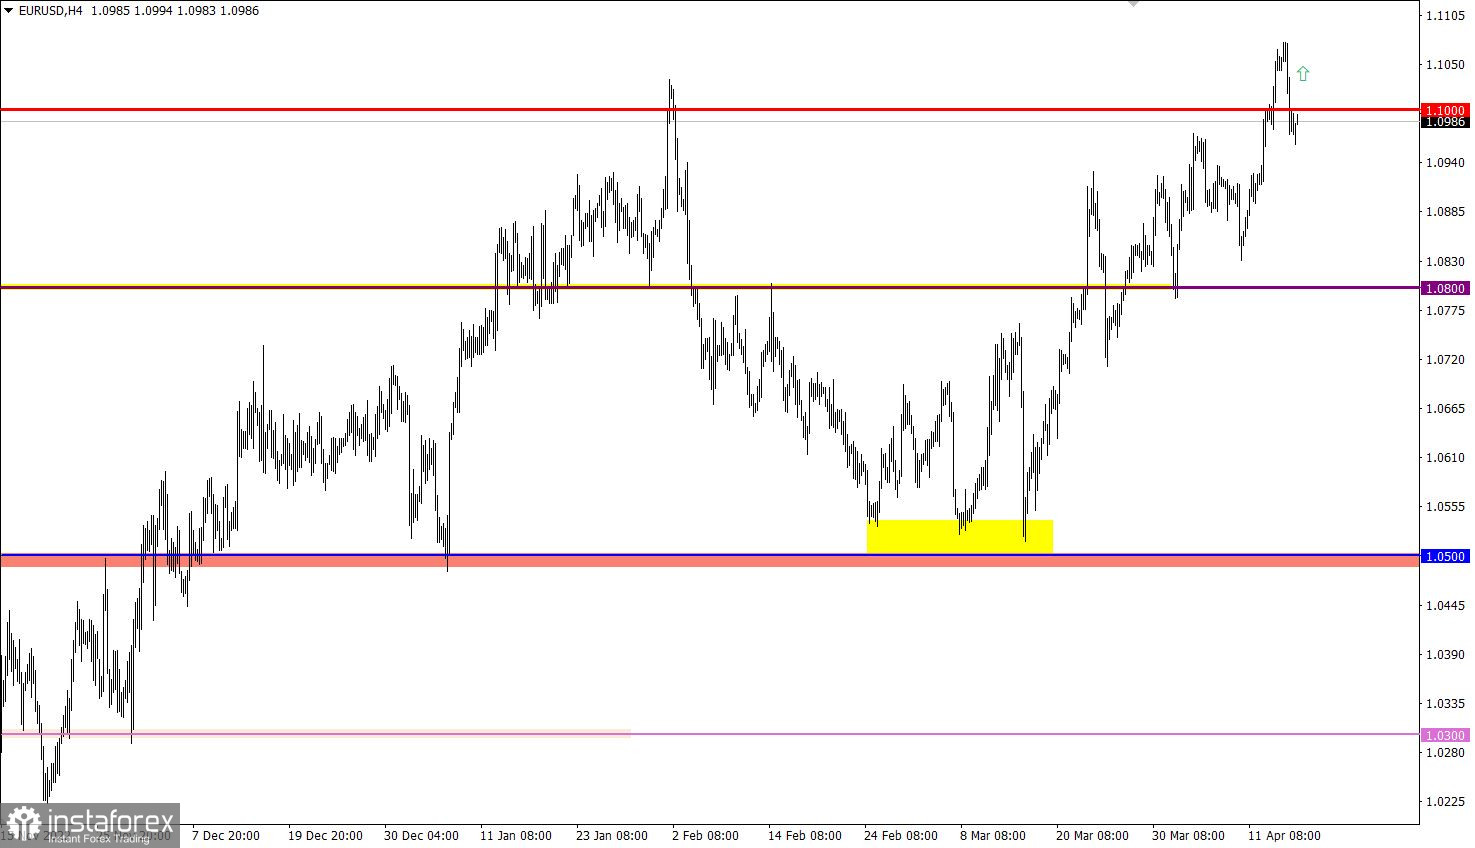
EUR/USD was in an upward inertia for almost the entire past week. As a result, the local high of the medium-term trend was updated. Due to the obvious technical signal of the euro's overbought rate, a pullback occurred during the intraday period, which returned the quote to the 1.1000 level.
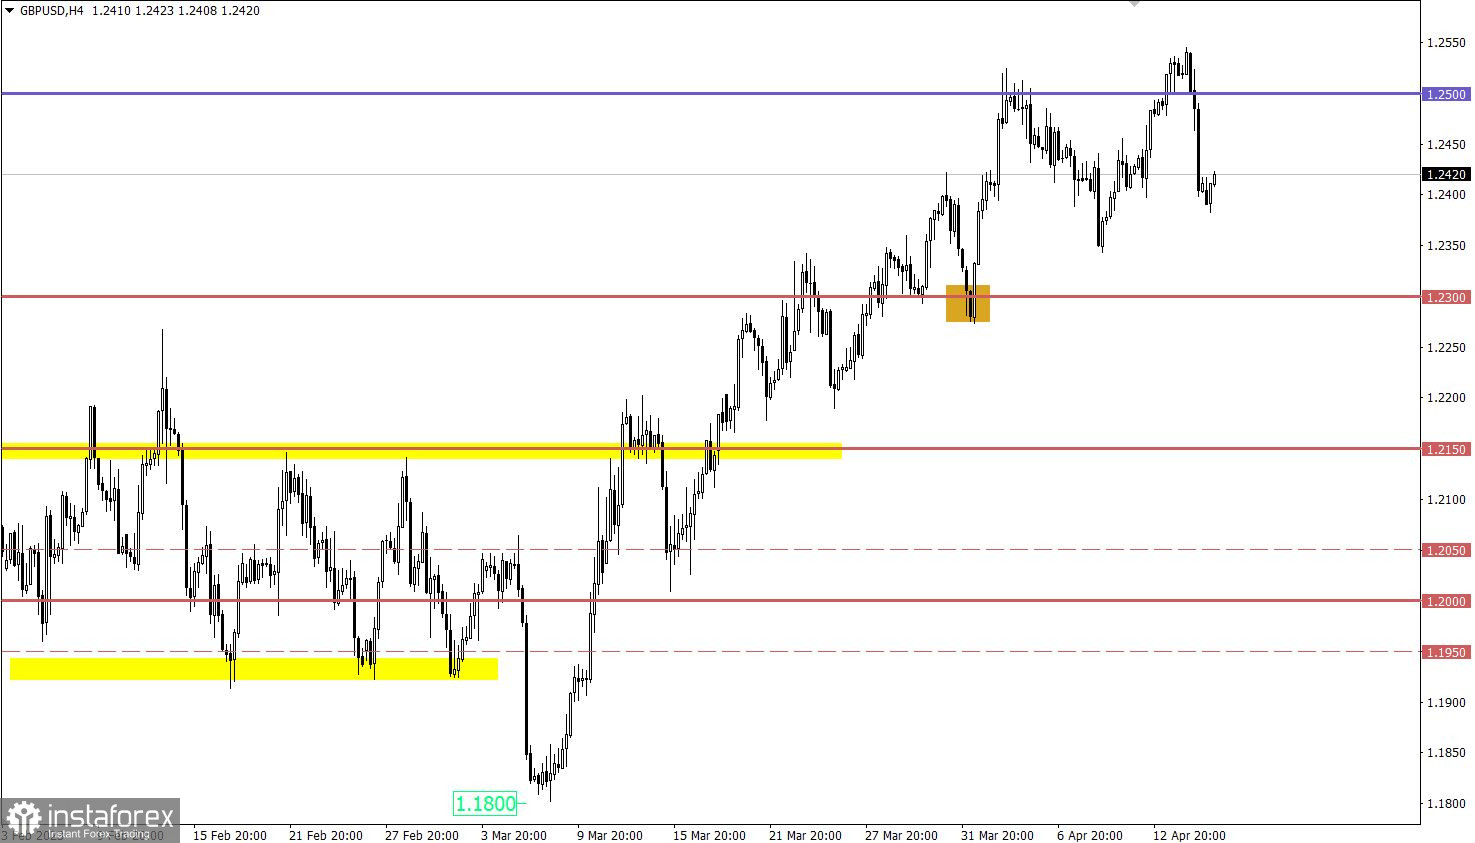
GBP/USD moved into the pullback stage after briefly holding the price above the 1.2500 level. Despite local manifestations of sellers' activity, there is still a medium-term upward trend in the market.
The economic calendar is traditionally empty on Monday. No important reports are expected in the EU, the United Kingdom, and the Unites States.
In this regard, investors and traders intend to focus on the incoming information and news flow. For example, today, representatives of the ECB will give a speech at 09:00 and 15:00 UTC.
It can be assumed that the pullback stage slowed down the formation in the area of the psychological level. This may lead to temporary stagnation, but if the quote goes above the 1.1050 mark, a new round of growth in the volume of long positions may occur. As for the pullback prolongation, a price retention below 1.0950 over a four-hour period is necessary for this signal to occur.
It can be assumed that the price returning to the 1.2500 level may lead to a new wave of growth in long positions, allowing for a prolongation of the medium-term trend. As for the pullback, there are assumptions that it is nearing completion, which may lead to temporary stagnation.
The candlestick chart type is white and black graphic rectangles with lines above and below. With a detailed analysis of each individual candle, you can see its characteristics relative to a particular time frame: opening price, closing price, intraday high and low.
Horizontal levels are price coordinates, relative to which a price may stop or reverse its trajectory. In the market, these levels are called support and resistance.
Circles and rectangles are highlighted examples where the price reversed in history. This color highlighting indicates horizontal lines that may put pressure on the asset's price in the future.
The up/down arrows are landmarks of the possible price direction in the future.
*这里的市场分析是为了增加您对市场的了解,而不是给出交易的指示。
InstaSpot分析评论将让您充分了解市场趋势! 作为InstaSpot的客户,您将获得大量的免费服务以实现有效的交易。


