


La légende dans l'équipe InstaSpot!
La vraie légende! Vous pensez que c'est trop pathétique? Mais comment pouvez-vous appeler un homme qui, à 18 ans, est devenu le premier champion du monde d'échecs parmi les jeunes hommes d'Asie, et à dix-neuf ans – le premier grand maître de l'histoire de son pays? Ce fut le début de la voie du champion d'échecs –Viswanathan Anand – l'homme qui a inscrit son nom à jamais dans l'histoire des échecs du monde. Une autre légende dans l'équipe d'InstaSpot!


Le FC Borussia est l'un des clubs de football les plus titrés d'Allemagne, qui a prouvé à maintes reprises à ses fans que l'esprit de rivalité et de leadership mènera certainement au succès. Négociez de la même manière que les professionnels du sport mènent le jeu: en toute confiance et activement. Devenez un leader avec le FC Borussia et soyez en tête avec l'équipe InstaSpot!
Trend analysis
EUR/USD will increase this week, starting from 1.0259 (closing of the last weekly candle) to 1.0368, which is the 50.0% retracement level (yellow dotted line). Then, it will continue moving up to the 61.8% retracement level at 1.0466 (yellow dotted line), before returning to 1.0273, which is the 13 EMA (yellow thin line). Quotes are likely to resume rising after these movements.
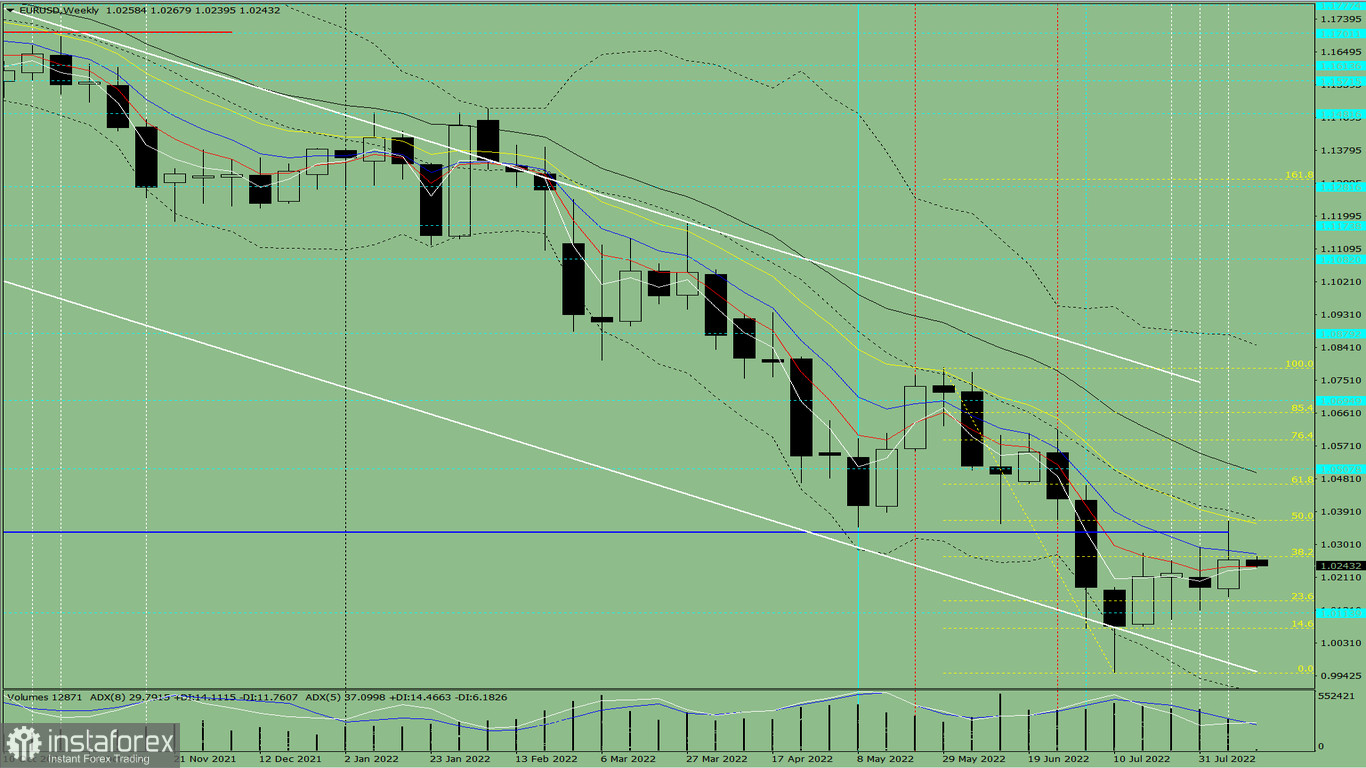
Fig. 1 (weekly chart)
Comprehensive analysis:
Indicator analysis - uptrend
Fibonacci levels - uptrend
Volumes - uptrend
Candlestick analysis - uptrend
Trend analysis - uptrend
Bollinger bands - uptrend
Monthly chart - uptrend
All this points to an upward movement in EUR/USD.
Conclusion: The pair will have an upward trend, with no first lower shadow on the weekly white candle (Monday - up) and no second upper shadow (Friday - up).
During the week, euro will climb from 1.0259 (closing of the last weekly candle) to the 50.0% retracement level at 1.0368 (yellow dotted line), go to the 61.8% retracement level at 1.0466 (yellow dotted line), and bounce back to the 13 EMA at 1.0273 (yellow thin line). Quotes are likely to resume rising after these movements.
Alternatively, the pair could dip from 1.0259 (closing of the last weekly candle) to the historical support level of 1.0114 (dashed blue line), then go up to the resistance line at 1.0335 (thick blue line).
*The market analysis posted here is meant to increase your awareness, but not to give instructions to make a trade.
InstaSpot analytical reviews will make you fully aware of market trends! Being an InstaSpot client, you are provided with a large number of free services for efficient trading.


