


The legend in the InstaSpot team!
Legend! You think that's bombastic rhetoric? But how should we call a man, who became the first Asian to win the junior world chess championship at 18 and who became the first Indian Grandmaster at 19? That was the start of a hard path to the World Champion title for Viswanathan Anand, the man who became a part of history of chess forever. Now one more legend in the InstaSpot team!


Borussia is one of the most titled football clubs in Germany, which has repeatedly proved to fans: the spirit of competition and leadership will certainly lead to success. Trade in the same way that sports professionals play the game: confidently and actively. Keep a "pass" from Borussia FC and be in the lead with InstaSpot!
Trend analysis
EUR/USD will increase this week, starting from 1.0259 (closing of the last weekly candle) to 1.0368, which is the 50.0% retracement level (yellow dotted line). Then, it will continue moving up to the 61.8% retracement level at 1.0466 (yellow dotted line), before returning to 1.0273, which is the 13 EMA (yellow thin line). Quotes are likely to resume rising after these movements.
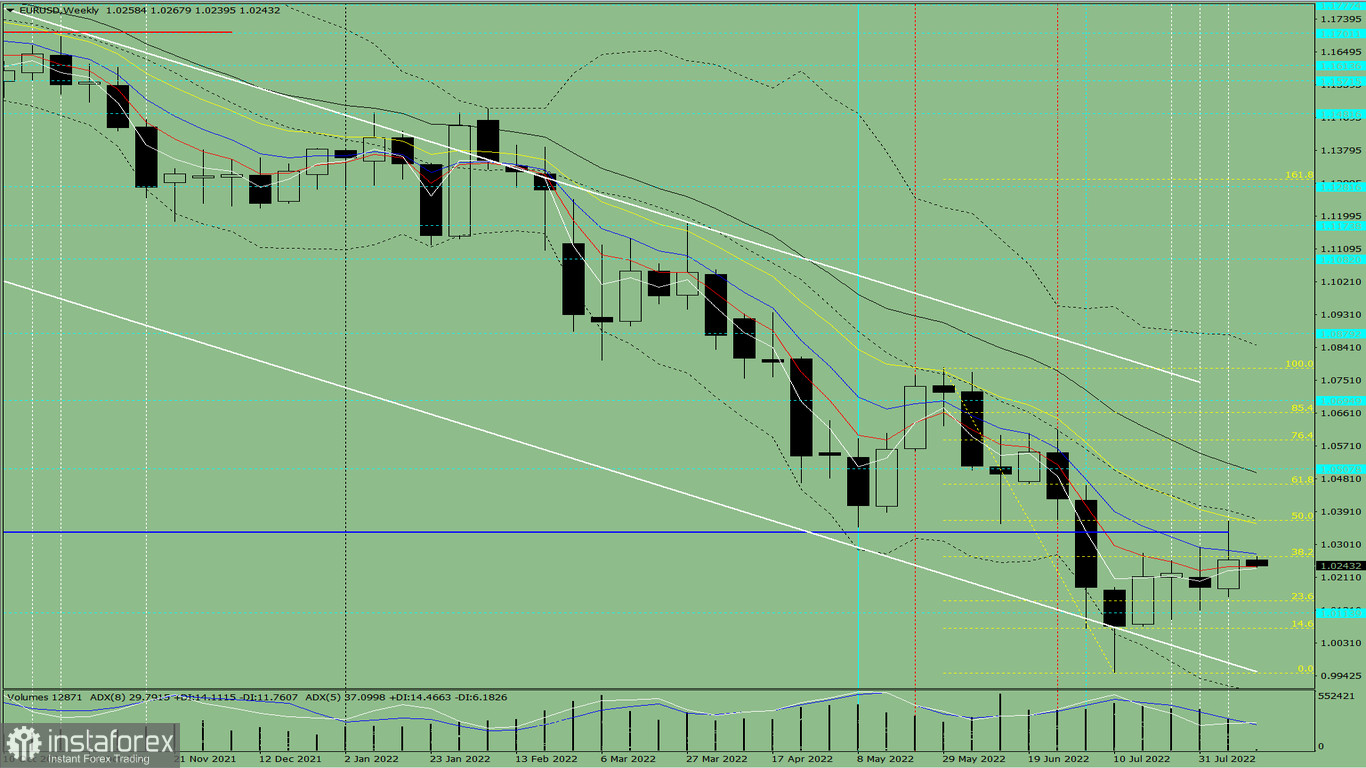
Fig. 1 (weekly chart)
Comprehensive analysis:
Indicator analysis - uptrend
Fibonacci levels - uptrend
Volumes - uptrend
Candlestick analysis - uptrend
Trend analysis - uptrend
Bollinger bands - uptrend
Monthly chart - uptrend
All this points to an upward movement in EUR/USD.
Conclusion: The pair will have an upward trend, with no first lower shadow on the weekly white candle (Monday - up) and no second upper shadow (Friday - up).
During the week, euro will climb from 1.0259 (closing of the last weekly candle) to the 50.0% retracement level at 1.0368 (yellow dotted line), go to the 61.8% retracement level at 1.0466 (yellow dotted line), and bounce back to the 13 EMA at 1.0273 (yellow thin line). Quotes are likely to resume rising after these movements.
Alternatively, the pair could dip from 1.0259 (closing of the last weekly candle) to the historical support level of 1.0114 (dashed blue line), then go up to the resistance line at 1.0335 (thick blue line).
*这里的市场分析是为了增加您对市场的了解,而不是给出交易的指示。
InstaSpot分析评论将让您充分了解市场趋势! 作为InstaSpot的客户,您将获得大量的免费服务以实现有效的交易。


