


Il y a maintenant plus de 7 millions de traders dans notre équipe! Chaque jour nous travaillons à améliorer le trading. On s'efforce de vous offrir le meilleur et on obtient les plus beaux succès.
La confiance de millions de traders partout dans le monde est l'évaluation la plus élevée de notre travail!
Vous avez fait votre choix et nous allons faire de notre mieux pour répondre à vos attentes!
Ensemble, nous faisons une super équipe!
InstaSpot est fier de vous servir!


L'acteur, le champion de l'UFC et un vrai bogatyr russe! . Homme qui ne doit sa réussite qu'à lui-même. L'homme qui est sur la même route que nous suivons.
Le secret du succès de Taktarov est le progrès permanent vers la réalisation de son objectif.
Découvrez toutes les facettes de votre talent! Apprenez, essayez, commettez des erreurs, mais ne vous arrêtez pas!
InstaSpot - L'histoire de votre succès commence ici !
The previous week closed with an almost empty macroeconomic calendar. Statistics were released only for individual EU countries, but the market was not interested in them, nor in the EU's lending market data.
Analysis of trading charts from January 28:
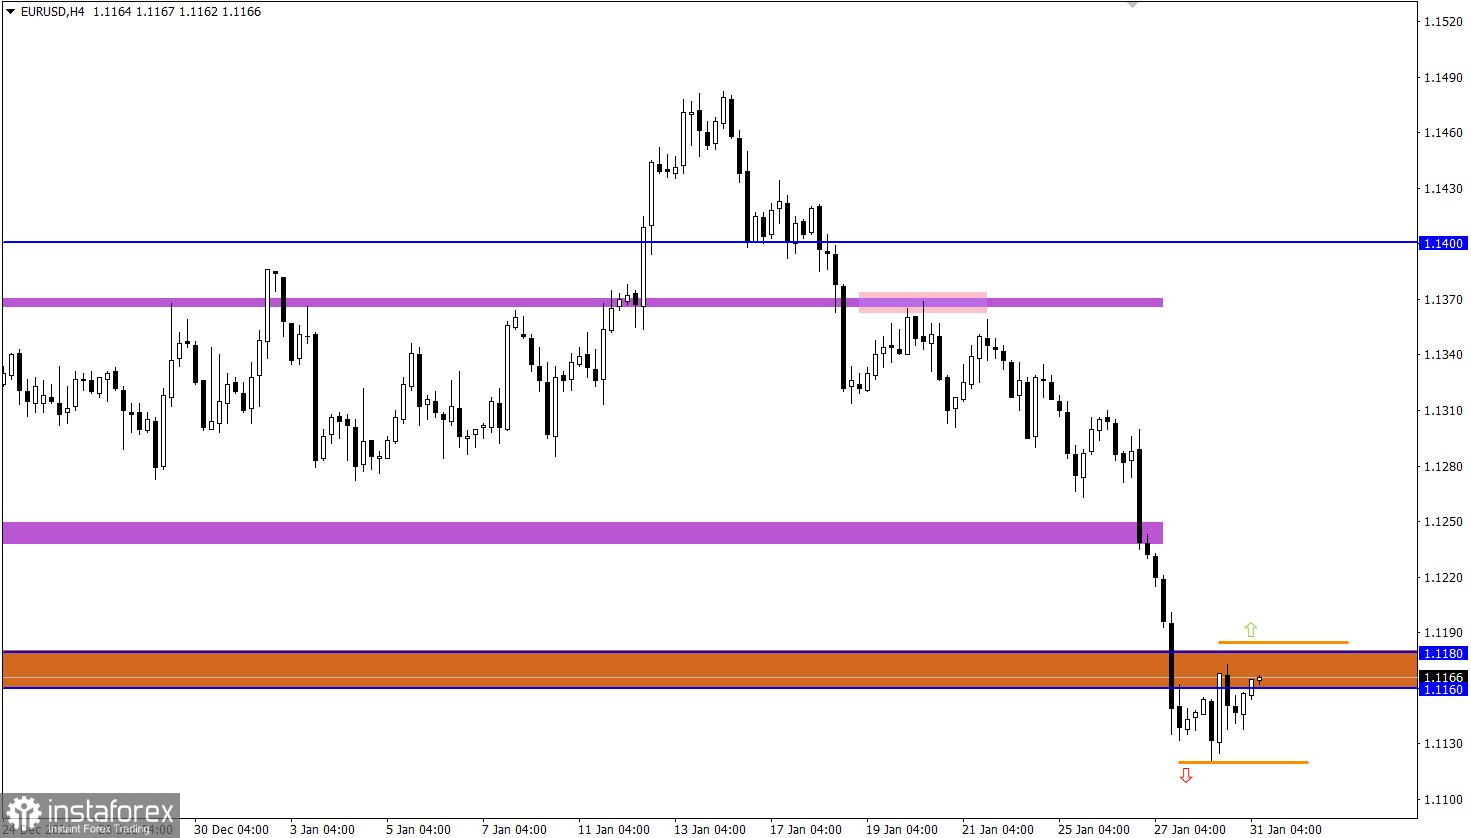
The EUR/USD pair formed a stagnation below the support area of 1.1160/1.1180 after a sharp decline. This move indicates a regrouping of trading forces, which could be the beginning of a correction.
The downward trend from June 2021 continues on the daily chart. The move brought traders back to the levels of June 2020. Therefore, the current stagnation or correction will not disrupt the global trend in any way.
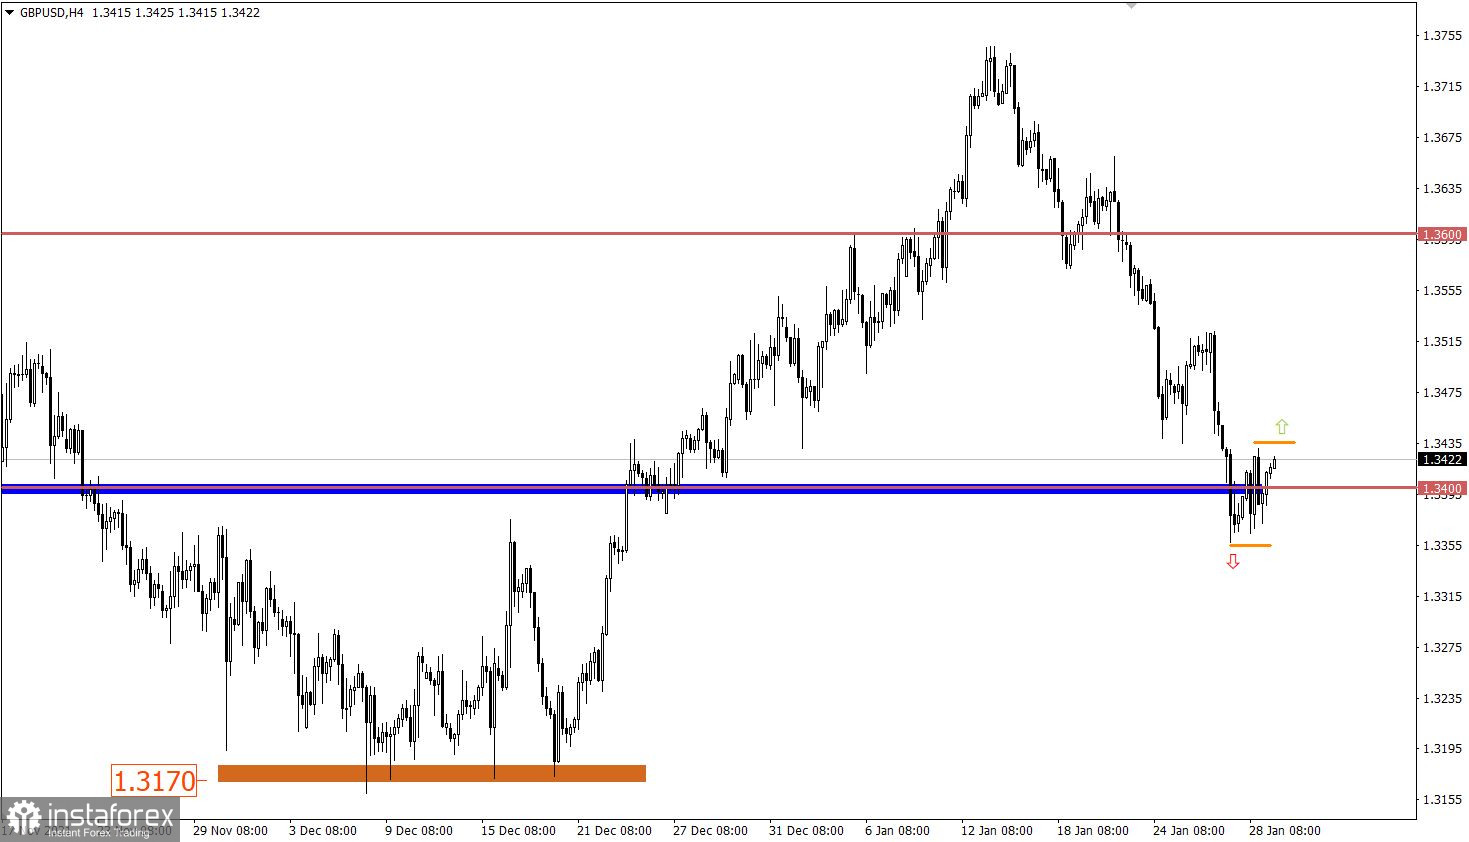
The GBP/USD pair slowed down its downward movement in the area of 1.3357, where a pullback occurred at the beginning, followed by a stagnation in the amplitude of 1.3360/1.3430. Given the pound's recent weakening, a correction is not ruled out if the current stagnation in the market drags on.
It is worth considering that when analyzing the daily trading chart, there is a gradual process of restoring downward interest. The quote has already gone over 60% relative to the recent upward cycle.
January 31 economic calendar:
The EU's preliminary data on GDP will be released today at 10:00 Universal time, where economic growth may accelerate from 3.9% to 4.7%. This statistical data may support the Euro currency.
Trading plan for EUR/USD on January 31:
According to the correctional pattern, the price movement will be confirmed in the market only after the price holds above the level of 1.1180. In this case, a movement towards 1.1210 - 1.1260 is not excluded. Otherwise, stagnation within the borders of 1.1120/1.1180 will continue to form.
Trading plan for GBP/USD on January 31:
In this situation, special attention is paid to the price range 1.3360/1.3430, since holding the price outside one or another border may well indicate a subsequent price move.
We express the above into trading signals:
What is reflected in the trading charts?
A candlestick chart view is graphical rectangles of white and black light, with sticks on top and bottom. When analyzing each candle in detail, you will see its characteristics of a relative period: the opening price, closing price, and maximum and minimum prices.
Horizontal levels are price coordinates, relative to which a stop or a price reversal may occur. These levels are called support and resistance in the market.
Circles and rectangles are highlighted examples where the price of the story unfolded. This color selection indicates horizontal lines that may put pressure on the quote in the future.
The up/down arrows are the reference points of the possible price direction in the future.
*The market analysis posted here is meant to increase your awareness, but not to give instructions to make a trade.
InstaSpot analytical reviews will make you fully aware of market trends! Being an InstaSpot client, you are provided with a large number of free services for efficient trading.


