


我们的团队有超过700万的操盘手!
我们每天都在一起努力改善交易。我们得到了很高的成绩,并继续前进。
世界各地数以百万计的操盘手的认可是我们工作的最大赞赏! 您做出了您的选择,我们将尽一切努力来满足您的期望!
我们是一个共同的伟大团队!
InstaSpot. 自豪地为您工作!


The previous week closed with an almost empty macroeconomic calendar. Statistics were released only for individual EU countries, but the market was not interested in them, nor in the EU's lending market data.
Analysis of trading charts from January 28:
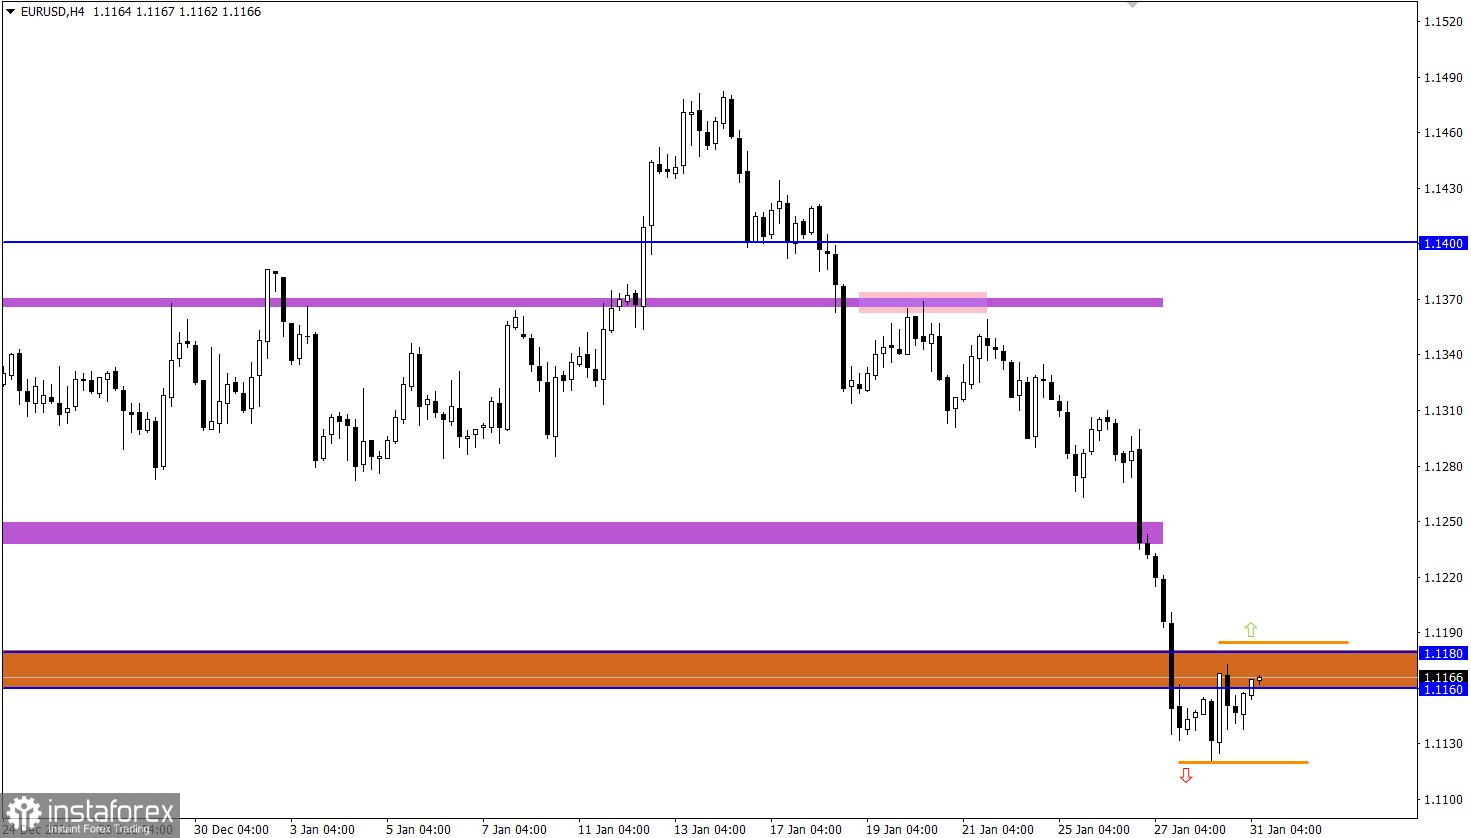
The EUR/USD pair formed a stagnation below the support area of 1.1160/1.1180 after a sharp decline. This move indicates a regrouping of trading forces, which could be the beginning of a correction.
The downward trend from June 2021 continues on the daily chart. The move brought traders back to the levels of June 2020. Therefore, the current stagnation or correction will not disrupt the global trend in any way.
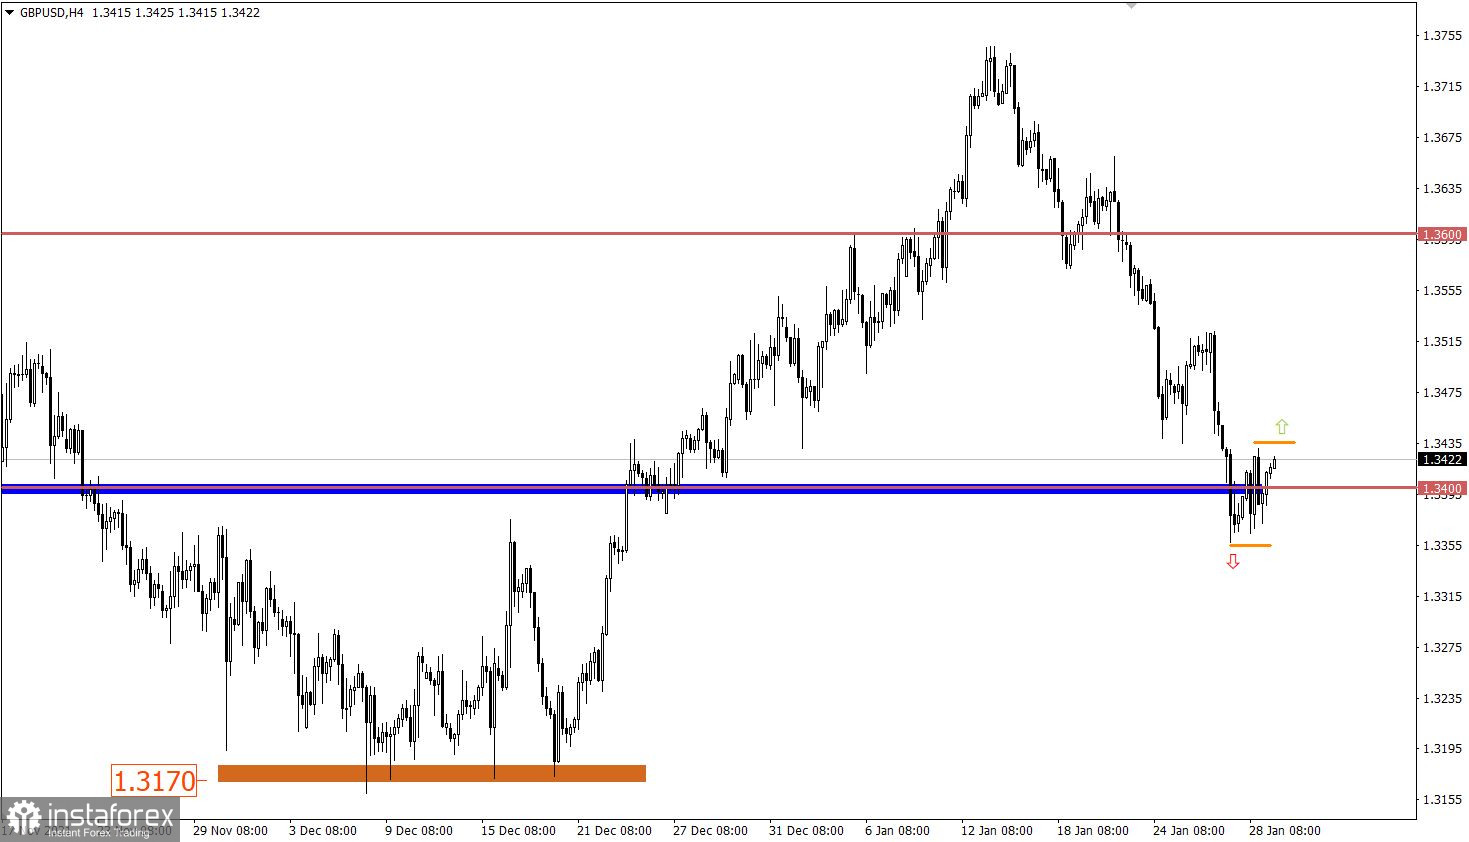
The GBP/USD pair slowed down its downward movement in the area of 1.3357, where a pullback occurred at the beginning, followed by a stagnation in the amplitude of 1.3360/1.3430. Given the pound's recent weakening, a correction is not ruled out if the current stagnation in the market drags on.
It is worth considering that when analyzing the daily trading chart, there is a gradual process of restoring downward interest. The quote has already gone over 60% relative to the recent upward cycle.
January 31 economic calendar:
The EU's preliminary data on GDP will be released today at 10:00 Universal time, where economic growth may accelerate from 3.9% to 4.7%. This statistical data may support the Euro currency.
Trading plan for EUR/USD on January 31:
According to the correctional pattern, the price movement will be confirmed in the market only after the price holds above the level of 1.1180. In this case, a movement towards 1.1210 - 1.1260 is not excluded. Otherwise, stagnation within the borders of 1.1120/1.1180 will continue to form.
Trading plan for GBP/USD on January 31:
In this situation, special attention is paid to the price range 1.3360/1.3430, since holding the price outside one or another border may well indicate a subsequent price move.
We express the above into trading signals:
What is reflected in the trading charts?
A candlestick chart view is graphical rectangles of white and black light, with sticks on top and bottom. When analyzing each candle in detail, you will see its characteristics of a relative period: the opening price, closing price, and maximum and minimum prices.
Horizontal levels are price coordinates, relative to which a stop or a price reversal may occur. These levels are called support and resistance in the market.
Circles and rectangles are highlighted examples where the price of the story unfolded. This color selection indicates horizontal lines that may put pressure on the quote in the future.
The up/down arrows are the reference points of the possible price direction in the future.
*这里的市场分析是为了增加您对市场的了解,而不是给出交易的指示。
InstaSpot分析评论将让您充分了解市场趋势! 作为InstaSpot的客户,您将获得大量的免费服务以实现有效的交易。


