




Our team has over 7,000,000 traders!
Every day we work together to improve trading. We get high results and move forward.
Recognition by millions of traders all over the world is the best appreciation of our work! You made your choice and we will do everything it takes to meet your expectations!
We are a great team together!
InstaSpot. Proud to work for you!





Actor, UFC 6 tournament champion and a true hero!
The man who made himself. The man that goes our way.
The secret behind Taktarov's success is constant movement towards the goal.
Reveal all the sides of your talent!
Discover, try, fail - but never stop!
InstaSpot. Your success story starts here!

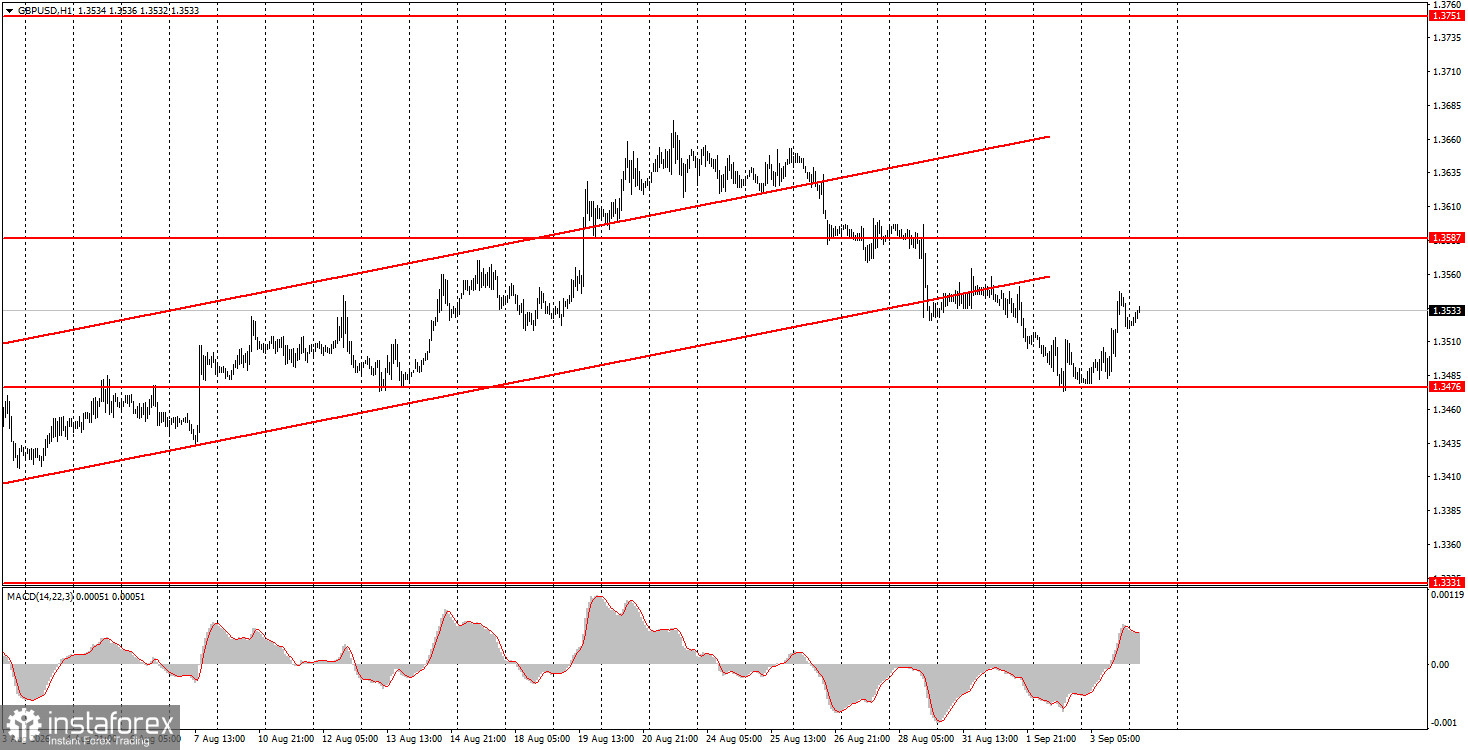
The GBP/USD pair also rose during Thursday even though the macro backdrop suggested a decline. Recall that this week only the US ISM services business activity index supported the dollar; all other reports did not. However, yesterday, when the ISM index was released, the US currency fell. We noted earlier that a technical correction has been unfolding in the market over the past two weeks. Such corrections occur independently of fundamental or macroeconomic background. The market begins to take profits on long positions, which is why we observe declines. This is why the macro backdrop and the pair's movements did not match this week. Regarding Federal Reserve policy, we still do not believe the key rate will be raised in September. We see no basis for that. Therefore, there is no reason for stronger dollar gains beyond a correction.
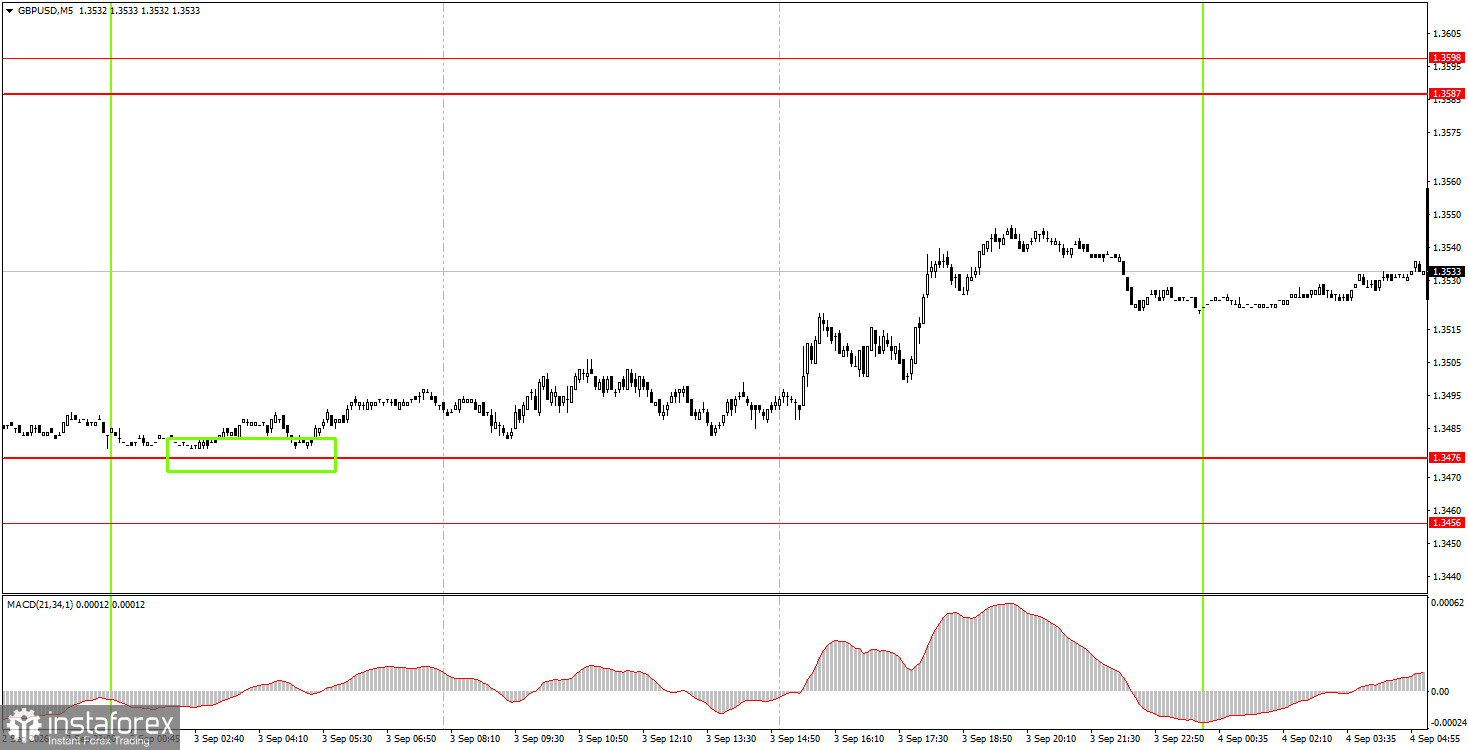
On the 5-minute TF on Thursday, one buy signal formed. During the Asian session, the price bounced from the 1.3456–1.3476 area and moved only upward until the end of the day. Thus, traders could open long positions in the morning and close them in profit of about 30–40 pips in the evening.
On the hourly TF, the GBP/USD pair continues a downward corrective trend. In our view, the pound should continue to rise in the medium term under any scenario, but it is currently in a correction. On the weekly TF, the move from the lower boundary of the lateral channel toward the upper boundary continues, and this move may not be complete. Last Friday improved the mood for the US dollar, but that support is unlikely to last long.
On Friday, novice traders may consider short positions targeting 1.3456–1.3476 if the price bounces from the 1.3587–1.3598 area. Long positions can be maintained with targets at 1.3587–1.3598 after a bounce from the 1.3456–1.3476 area.
On the 5-minute TF, you can trade the levels 1.3259–1.3267, 1.3319–1.3331, 1.3380–1.3386, 1.3456–1.3476, 1.3587–1.3598, 1.3631–1.3641, 1.3695, 1.3741. No major events are scheduled in the UK on Friday, but they are not needed. In the US, important reports will be released today that the market has been awaiting since Monday — Nonfarm Payrolls and the unemployment rate. High volatility is expected in the afternoon.
Price levels (areas) of support and resistance are levels that serve as targets when opening buy or sell trades, or as sources of signals.
Red lines indicate channels or trend lines that illustrate the current trend and show the preferred direction for trading.
The MACD indicator (14,22,3) — the histogram and signal line — is an auxiliary indicator that can also be used as a source of signals.
Important speeches and reports (contained in the news calendar) can significantly influence the movement of currency pairs. Therefore, during their release, trading should be approached with utmost caution, or traders should exit the market to avoid sudden reversals against the preceding movement.
Beginner forex traders should remember that not every trade can be profitable. Developing a clear strategy and practicing money management are key to long-term success in trading.
*The market analysis posted here is meant to increase your awareness, but not to give instructions to make a trade.
InstaSpot analytical reviews will make you fully aware of market trends! Being an InstaSpot client, you are provided with a large number of free services for efficient trading.


