




Our team has over 7,000,000 traders!
Every day we work together to improve trading. We get high results and move forward.
Recognition by millions of traders all over the world is the best appreciation of our work! You made your choice and we will do everything it takes to meet your expectations!
We are a great team together!
InstaSpot. Proud to work for you!





Actor, UFC 6 tournament champion and a true hero!
The man who made himself. The man that goes our way.
The secret behind Taktarov's success is constant movement towards the goal.
Reveal all the sides of your talent!
Discover, try, fail - but never stop!
InstaSpot. Your success story starts here!

Bitcoin and Ether retain strong potential for further gains, trading near the lower boundary of the sideways channel.
On-chain data show that approximately 880,000 bitcoins currently have an average purchase price in the $77,500–$80,300 range, meaning that a significant group of holders owns the asset at nearly the same price at which they initially acquired it.

With Bitcoin currently trading around $77,000–$77,700, this zone effectively coincides with the market price rather than being far into profit or loss, as is usually the case for most holders during a pronounced trend. Such a concentration creates a psychologically sensitive area on the chart, where holders' sentiment can shift sharply from calm to concern and back again following relatively small price movements.
The scale of this concentration has tangible practical implications. Even minor price fluctuations can move tens of billions of dollars worth of Bitcoin between profit and loss, potentially releasing supply from investors who have been in a loss position for months and can now exit at breakeven or a small profit. Historically, such cost-basis concentration zones become areas of heightened volatility because holders' psychology changes sharply around the breakeven point. After a long period of waiting, the desire to lock in at least some return often outweighs the willingness to continue holding the position in anticipation of higher profits.
So far, the market has absorbed this selling pressure, with some of the potential supply being absorbed by large buyers, including corporate crypto treasuries such as Strategy, which has resumed active Bitcoin purchases in recent weeks precisely at these levels. However, how long such demand can neutralize the growing number of holders willing to sell as the price approaches breakeven remains an open question.
If selling pressure begins to increase faster than institutional buyers are willing to absorb it, the $77,500–$80,300 level could turn from an area of relative equilibrium into a zone that determines the market's next direction: upward in the event of a sustained breakout, or downward if the number of holders seeking to lock in at least a breakeven result exceeds the number of buyers on the other side of the trade.
Bitcoin
Buying Scenario
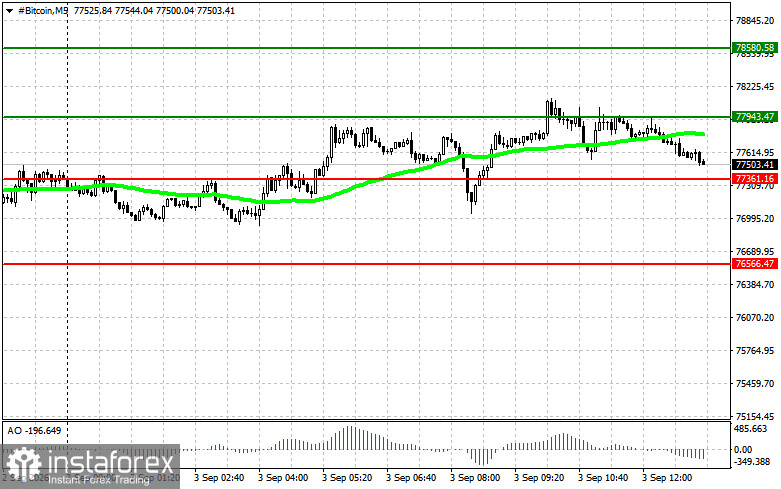
Scenario #1: Today, I will buy Bitcoin when the entry point is reached around $77,900, with a target of $78,600. Around $78,600, I will close the long position and immediately look to sell on a rebound. Before buying on a breakout, make sure that the 50-day moving average is below the current price and that the Awesome Oscillator is above zero.
Scenario #2: Bitcoin can be bought from the lower boundary at $77,300 if there is no market reaction to a breakout below this level, with a return toward $77,900 and $78,600.
Selling Scenario
Scenario #1: Today, I will sell Bitcoin when the entry point is reached around $77,300, with a target of $76,500. Around $76,500, I will close the short position and immediately look to buy on a rebound. Before selling on a breakout, make sure that the 50-day moving average is above the current price and that the Awesome Oscillator is below zero.
Scenario #2: Bitcoin can be sold from the upper boundary at $77,900 if there is no market reaction to a breakout above this level, with a return toward $77,300 and $76,500.
Ethereum
Buying Scenario
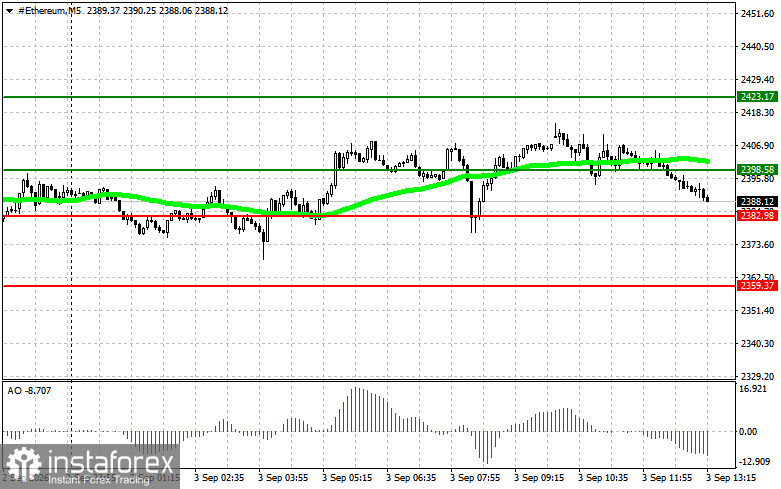
Scenario #1: Today, I will buy Ether when the entry point is reached around $2,398, with a target of $2,423. Around $2,423, I will close the long position and immediately look to sell on a rebound. Before buying on a breakout, make sure that the 50-day moving average is below the current price and that the Awesome Oscillator is above zero.
Scenario #2: Ether can be bought from the lower boundary at $2,382 if there is no market reaction to a breakout below this level, with a return toward $2,398 and $2,423.
Selling Scenario
Scenario #1: Today, I will sell Ether when the entry point is reached around $2,382, with a target of $2,359. Around $2,359, I will close the short position and immediately look to buy on a rebound. Before selling on a breakout, make sure that the 50-day moving average is above the current price and that the Awesome Oscillator is below zero.
Scenario #2: Ether can be sold from the upper boundary at $2,398 if there is no market reaction to a breakout above this level, with a return toward $2,382 and $2,359.
*The market analysis posted here is meant to increase your awareness, but not to give instructions to make a trade.
InstaSpot analytical reviews will make you fully aware of market trends! Being an InstaSpot client, you are provided with a large number of free services for efficient trading.


