




Our team has over 7,000,000 traders!
Every day we work together to improve trading. We get high results and move forward.
Recognition by millions of traders all over the world is the best appreciation of our work! You made your choice and we will do everything it takes to meet your expectations!
We are a great team together!
InstaSpot. Proud to work for you!





Actor, UFC 6 tournament champion and a true hero!
The man who made himself. The man that goes our way.
The secret behind Taktarov's success is constant movement towards the goal.
Reveal all the sides of your talent!
Discover, try, fail - but never stop!
InstaSpot. Your success story starts here!

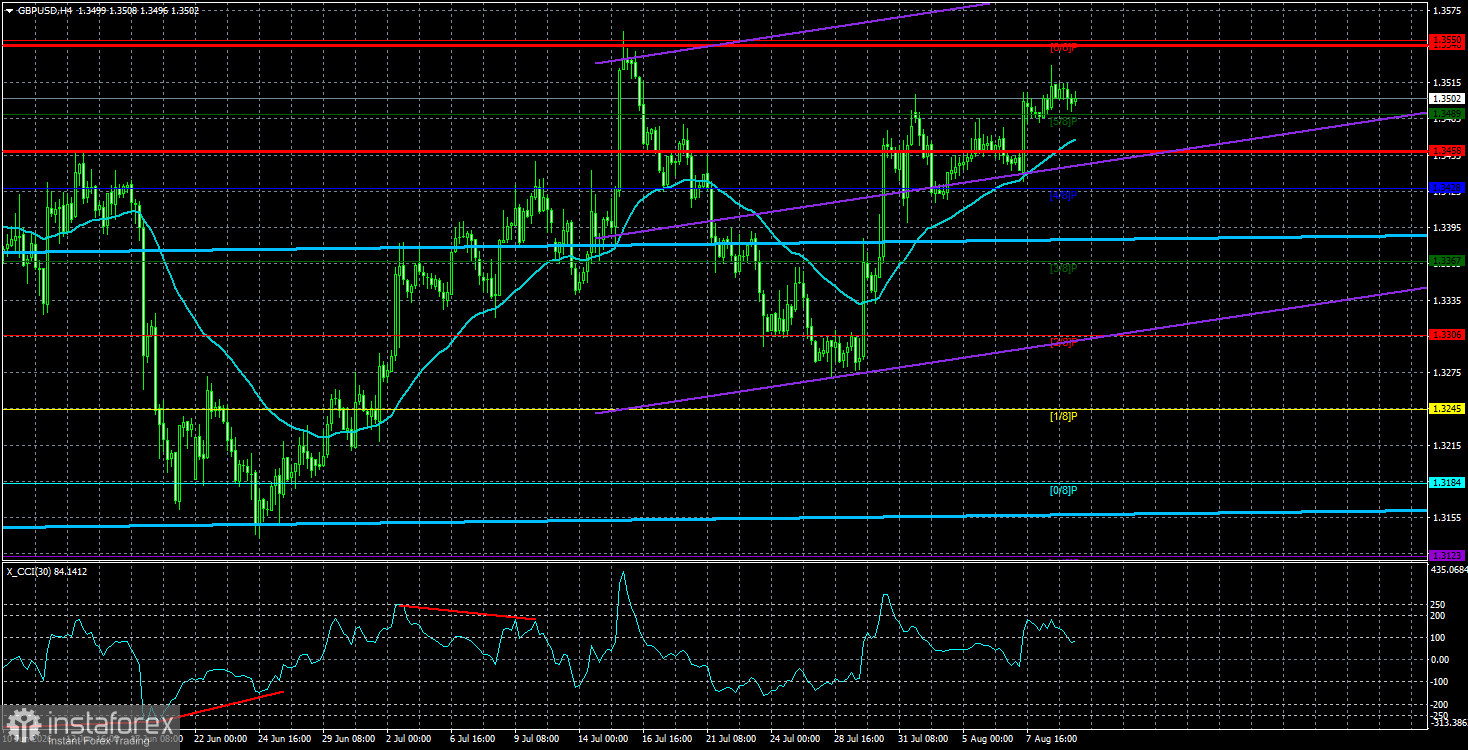
The GBP/USD currency pair also did not show any notable moves on Tuesday, and the macroeconomic and fundamental backdrop was again absent. Thus, volatility was again low, and the market continues to ignore all of Donald Trump's statements regarding geopolitics.
On Tuesday, the US President stated that the Strait of Hormuz is under US Navy control and fully open to anyone who wishes to use it. At the same time, Iran maintains a blockade of the strait and demands that the US meet several conditions. And a reasonable question arises: what exactly is Trump talking about? Open for whom? If Iran can at any moment strike any vessel passing through the strait, how can it be considered open, let alone safe?
However, Trump's statement encapsulates the essence of his policy. It doesn't matter what the true situation is; what matters is what Trump said. If Trump said the strait is open, then the strait is open. And if Iran sinks a few ships there, then Iran is the evil actor, once again violating the terms of the truce. In fact, the strait remains blocked, because it will only be open when Iran publicly announces free traffic through it. Until Tehran makes such statements, the strait remains under blockade. And Trump could just as well tomorrow announce a US victory over Iran, the destruction of its nuclear program, payment of compensation by Iran, or anything else.
The fact remains: the conflict persists, but neither side intends to compromise or to escalate. Since there is no escalation, the market has no reason to buy the dollar. Since the strait remains closed, oil prices continue to rise. Fuel in the US is again getting more expensive against the backdrop of falling stocks and supply; therefore, inflation in August may jump up again. And that would normally support dollar strength amid rising inflation, except that the Federal Reserve cannot raise interest rates because of weakness in the labor market... Thus, whether the strait is open or closed, whether inflation is high or low, it makes little difference for the dollar now.
Of course, the situation can change at any moment as it has throughout 2026. If inflation jumps to outrageously high levels, the Fed may tighten policy, even despite a weak labor market. But for that, the consumer price index must first reach outrageous levels. So far, it is not bad enough to trigger alarm. And Trump generally believes that current inflation is quite normal. Trump appointed Kevin Warsh. Therefore, we believe the British currency will continue to rise in the medium term, as it remains within a one-year sideways channel on the daily timeframe and continues to move toward its upper boundary.
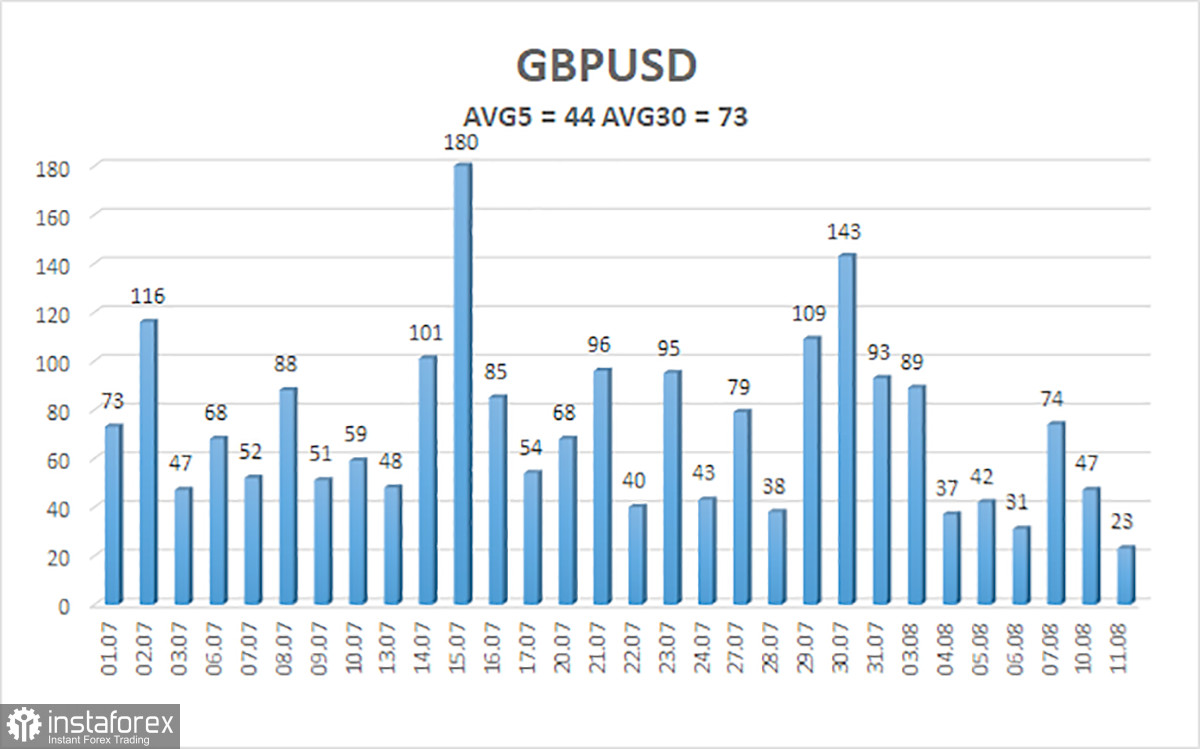
The average volatility of the GBP/USD pair over the last 5 trading days is 44 pips. For the pound/dollar pair, this value is "low." On Wednesday, August 12, therefore, we expect movement within the range bounded by levels 1.3458 and 1.3548. The upper linear regression channel is sloping downward, indicating a downtrend. The CCI indicator has entered the overbought area twice, which may provoke a new downward retracement.
S1 – 1.3489
S2 – 1.3428
S3 – 1.3367
R1 – 1.3550
R2 – 1.3611
R3 – 1.3672
The GBP/USD currency pair maintains an upward trend. Trump's policies will continue to put pressure on the US economy, so we do not expect long-term strength from the US dollar. The year 2026 is shaping up to be super-positive for the dollar due to geopolitics, but every fairy tale comes to an end. On the weekly timeframe, there remains a flat between levels 1.3150 and 1.3780 within a four-year uptrend, which suggests continued growth of the British currency in the medium term. Long positions with targets of 1.3548 and 1.3550 can be considered when the price is above the moving average. The price below the moving average line allows for bearish trading, with targets at 1.3428 and 1.3367.
*The market analysis posted here is meant to increase your awareness, but not to give instructions to make a trade.
InstaSpot analytical reviews will make you fully aware of market trends! Being an InstaSpot client, you are provided with a large number of free services for efficient trading.


