




Our team has over 7,000,000 traders!
Every day we work together to improve trading. We get high results and move forward.
Recognition by millions of traders all over the world is the best appreciation of our work! You made your choice and we will do everything it takes to meet your expectations!
We are a great team together!
InstaSpot. Proud to work for you!





Actor, UFC 6 tournament champion and a true hero!
The man who made himself. The man that goes our way.
The secret behind Taktarov's success is constant movement towards the goal.
Reveal all the sides of your talent!
Discover, try, fail - but never stop!
InstaSpot. Your success story starts here!

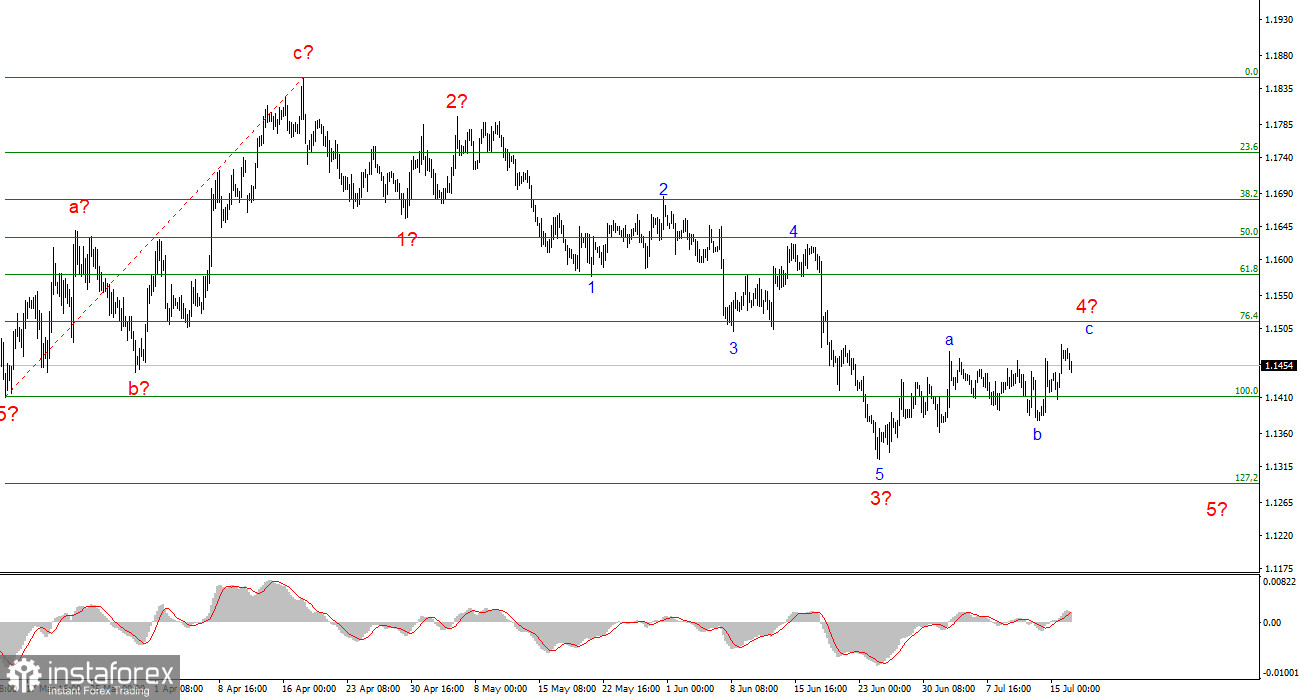
The 4-hour Elliott Wave structure for EUR/USD is becoming more complex. There is still no indication that the bullish trend segment (lower chart), which began in January of last year, has been invalidated. However, the wave structure of the trend has now taken on a corrective form.
From a long-term perspective, the market should be expected to form wave C, with its low expected to move below the low of wave A. At present, the low of wave C is already below the low of wave A, meaning that wave C could be completed at any time. However, if the fundamental background remains favorable for the U.S. dollar, this wave could develop into a much more extended structure.
On the lower time frame, I can identify a classic five-wave bearish structure. If this assumption is correct, the pair is currently forming wave 4, while wave 3 has developed into a five-wave structure. Once this formation is complete, the instrument may begin a new bullish wave sequence. However, according to the current wave count, wave 5 still needs to be formed. Therefore, the euro may decline toward the 13th figure (1.1300 level).
EUR/USD declined by 10 basis points on Thursday, with the total daily range reaching only 15 points. A closer look at the pair's price action shows that for almost a month, EUR/USD has either remained unchanged or moved only marginally.
The euro remains in the process of forming a corrective wave, which is assumed to be wave 4 of C. If this interpretation is correct, the market should eventually form wave 5 of C. However, wave 4 has clearly become prolonged. It has already taken a three-wave structure, but theoretically it could develop into a much larger corrective formation.
It is important to remember that waves do not determine market movements. The market determines price movements, while wave analysis only visualizes and analyzes those movements. Therefore, wave 4 could continue developing for several more weeks, but it could also end at any moment.
I believe wave 5 could turn out to be a shortened wave and coincide with the corrective wave in GBP/USD, after which both the euro and the pound could begin forming new bullish trend segments.
Economic data and significant events were limited today. In the United States, the retail sales report showed that consumer spending increased by 0.2% in June, in line with the expectations of most market participants.
Several FOMC members also delivered speeches, noticeably softening their tone following the June U.S. inflation report and Kevin Warsh's testimony before Congress. The futures market now prices in a 12% probability of monetary policy tightening in July and a 56% probability in September. These estimates are significantly lower than last week.
Unfortunately, these forecasts and comments from FOMC members are of limited significance. Tomorrow, the situation in the Middle East could change, oil prices could decline again, inflation could continue slowing, and the probability of monetary tightening by year-end could fall further. Alternatively, conditions could deteriorate, Yemen could block the Red Sea, oil prices could rise toward $150 per barrel, and inflation could return to double-digit levels. In that scenario, the Federal Reserve could tighten monetary policy as early as July.
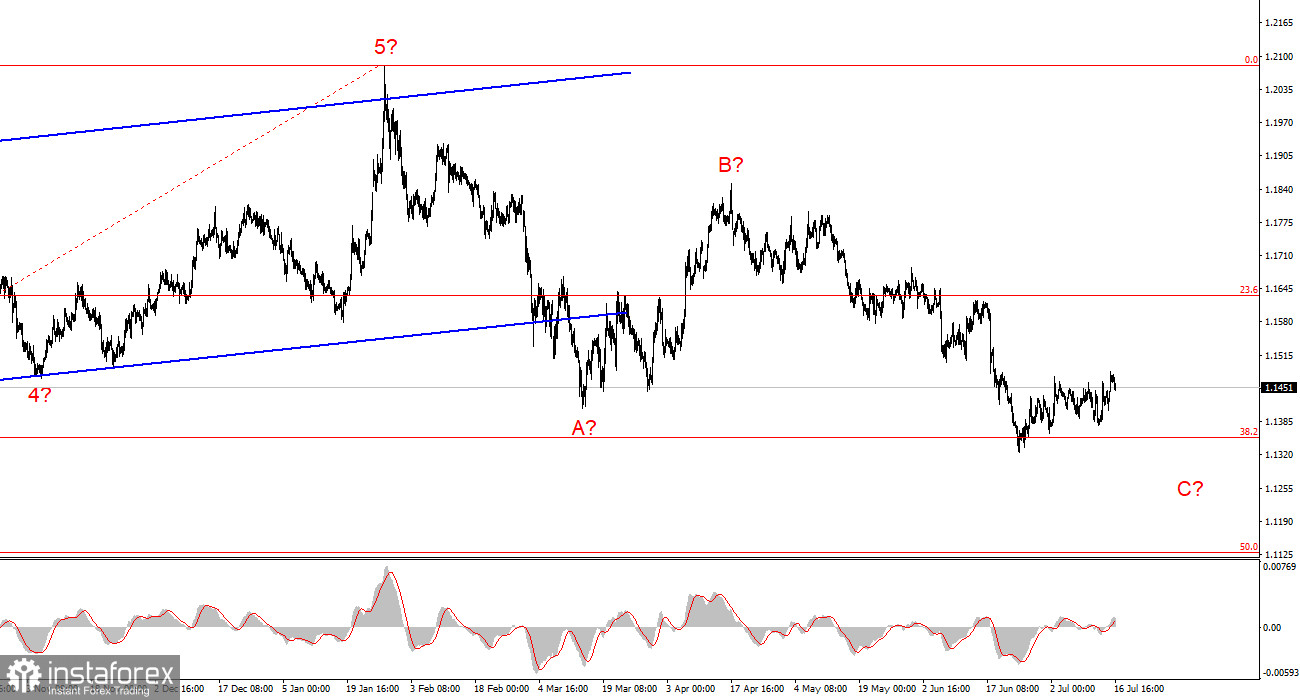
Based on the EUR/USD analysis, I conclude that the pair remains within a bullish trend segment (lower chart), while in the shorter term it remains within a bearish trend segment.
In my view, the current environment provides a reasonable opportunity to consider building long positions, although the pair may still decline toward the 1.1300 level as part of wave 5 of C. Wave analysis often produces unexpected developments, so I would already begin adjusting my strategy toward potential buying opportunities.
On the higher time frame, a bullish trend segment is visible, followed by the development of a corrective wave structure. In the near term, wave C is expected to form with targets around 1.1352, which corresponds to the 38.2% Fibonacci retracement level. Once the A-B-C correction is complete, a new long-term bullish trend may begin.
*The market analysis posted here is meant to increase your awareness, but not to give instructions to make a trade.
InstaSpot analytical reviews will make you fully aware of market trends! Being an InstaSpot client, you are provided with a large number of free services for efficient trading.


