


The legend in the InstaSpot team!
Legend! You think that's bombastic rhetoric? But how should we call a man, who became the first Asian to win the junior world chess championship at 18 and who became the first Indian Grandmaster at 19? That was the start of a hard path to the World Champion title for Viswanathan Anand, the man who became a part of history of chess forever. Now one more legend in the InstaSpot team!


Borussia is one of the most titled football clubs in Germany, which has repeatedly proved to fans: the spirit of competition and leadership will certainly lead to success. Trade in the same way that sports professionals play the game: confidently and actively. Keep a "pass" from Borussia FC and be in the lead with InstaSpot!

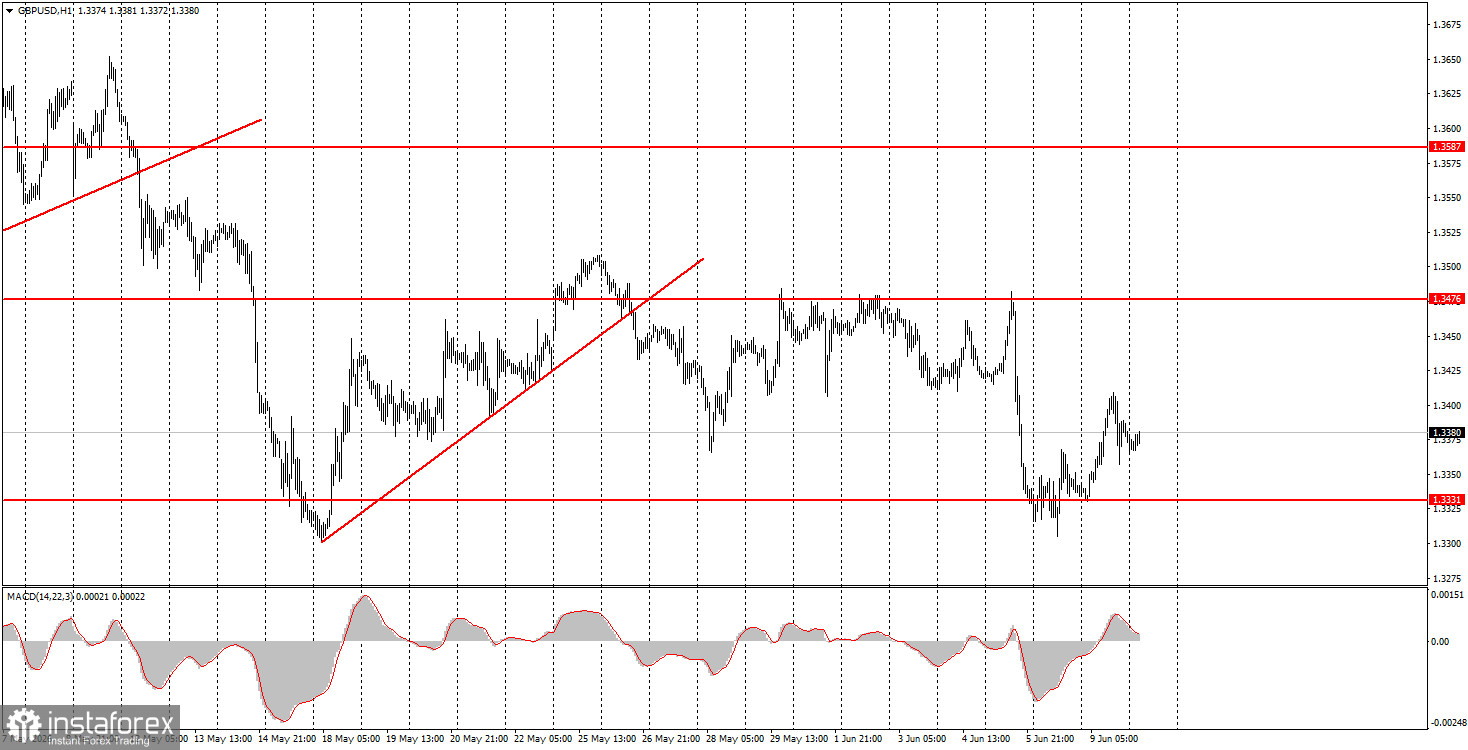
The GBP/USD pair also traded in different directions on Tuesday, as during the day the market first reacted to Trump's promises of a swift end to the war with Iran and the opening of the Strait of Hormuz, and then to the Iranian downing of an American helicopter and Trump's threats to carry out an act of retaliation. Only God knows at what stage the negotiations with Tehran are, but we tend to believe that they are far from completion and that the parties are far from mutual understanding. Let's recall that Tehran regularly denies Trump's claims about the closeness of a deal. Yesterday, the U.S. president stated that Iran is ready to abandon nuclear weapons, which Tehran has also repeatedly denied in the past. Essentially, on Tuesday, Iranian officials didn't even need to make official denial statements; they simply shot down an American helicopter. There's no point in trying to determine who is right or wrong in this situation, as no one will tell the truth. The British pound remains within the 1.3331-1.3476 range, and the market remains in a state of complete uncertainty.
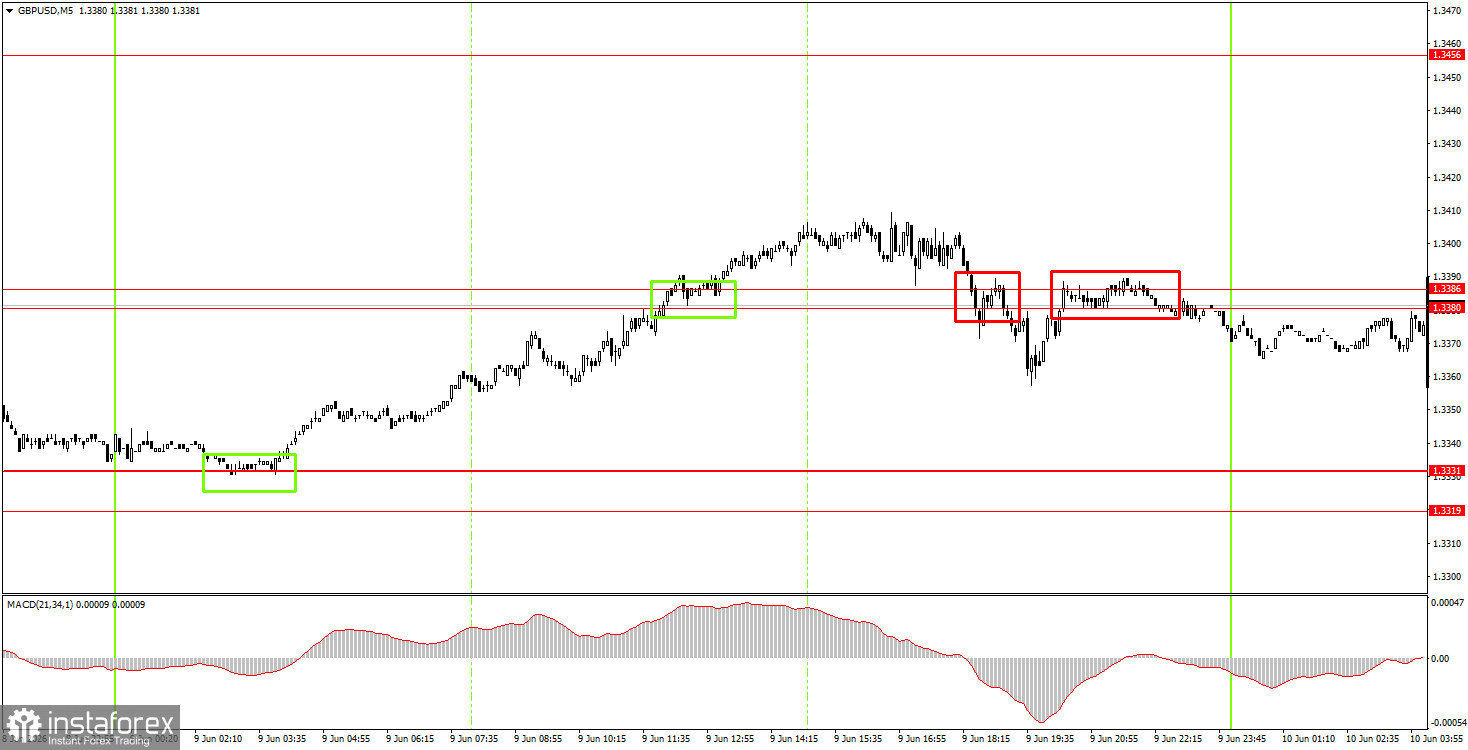
On the 5-minute timeframe on Tuesday, several interesting trading signals were formed. During the Asian trading session, the price bounced well from the 1.3319-1.3331 area, but not all novice traders were able to take advantage of this signal. The pair then broke the 1.3380-1.3386 area; however, the upward momentum essentially ended there. Two sell signals in the second half of the day suggest the possibility of the pair declining toward the 1.3319-1.3331 area today.
On the hourly timeframe, the GBP/USD pair continues to form a downward trend as the geopolitical situation remains consistently poor, and the ascending trend line has been breached. However, without a full resumption of the war in the Middle East, the dollar cannot expect the growth it saw in February-March. Individual events may still prompt further strengthening (as happened on Friday), but we do not believe the market will trigger a new wave of risk aversion towards the dollar. The dollar under Trump is itself a risk asset.
On Wednesday, novice traders may open short positions targeting 1.3319-1.3331 if the price bounces from the 1.3380-1.3386 area. A price consolidation above the 1.3380-1.3386 area will allow for long positions with a target of 1.3456.
On the 5-minute timeframe, current levels to trade are 1.3175-1.3180, 1.3259-1.3267, 1.3319-1.3331, 1.3380-1.3386, 1.3456-1.3476, 1.3587-1.3598, 1.3631-1.3641, 1.3695, and 1.3741-1.3751. On Tuesday, no important events or reports are scheduled in the UK, but in the U.S., an important inflation report will be released. Additionally, America may strike Iran as a retaliation for the downed helicopter.
Price levels (areas) of support and resistance are targets when opening long or short positions or sources of signals.
Red lines indicate channels or trend lines that display the current trend and indicate the preferred direction for trading.
The MACD indicator (14,22,3) – histogram and signal line – is a supplementary indicator that can also be used as a source of signals.
Important speeches and reports (contained in the news calendar) can significantly impact the movement of the currency pair. Therefore, during their release, trading should be conducted with maximum caution, or one should exit the market to avoid sharp reversals against preceding movements.
Beginners trading in the forex market should remember that not every trade can be profitable. Developing a clear strategy and practicing money management are keys to success in trading over the long term.
*The market analysis posted here is meant to increase your awareness, but not to give instructions to make a trade.
InstaSpot analytical reviews will make you fully aware of market trends! Being an InstaSpot client, you are provided with a large number of free services for efficient trading.


