


The legend in the InstaSpot team!
Legend! You think that's bombastic rhetoric? But how should we call a man, who became the first Asian to win the junior world chess championship at 18 and who became the first Indian Grandmaster at 19? That was the start of a hard path to the World Champion title for Viswanathan Anand, the man who became a part of history of chess forever. Now one more legend in the InstaSpot team!


Borussia is one of the most titled football clubs in Germany, which has repeatedly proved to fans: the spirit of competition and leadership will certainly lead to success. Trade in the same way that sports professionals play the game: confidently and actively. Keep a "pass" from Borussia FC and be in the lead with InstaSpot!

The EUR/USD currency pair continued its upward movement on Friday, which is a key point. Recall that last week, the situation in the Middle East unexpectedly began to improve, but it is still unclear whether peace will be achieved. Iran, Israel, and the US agreed to a two-week ceasefire and the unblocking of the Strait of Hormuz on Wednesday night, but by Wednesday afternoon, Israel had shelled Lebanon, and Iran gleefully launched rockets at Bahrain and Kuwait. As for the Strait of Hormuz, it remains blocked. Thus, there is smoke but no visible fire. The market has decided that a mythical ceasefire and future negotiations are preferable to military action, so it has begun to dispose of the US dollar as a safe asset. On Friday, the currency market situation did not change, which is very important.
From a technical perspective, a new upward trend is forming on the hourly timeframe. However, all traders understand that if negotiations fail, the war will continue and the Strait of Hormuz will remain blocked, and demand for the dollar may rise again. We are confident that geopolitics will not favor the dollar for another six months, for example, but it is also extremely difficult to determine the moment it will finally recede into the background. Therefore, it is not yet wise to ignore geopolitics in the near future.
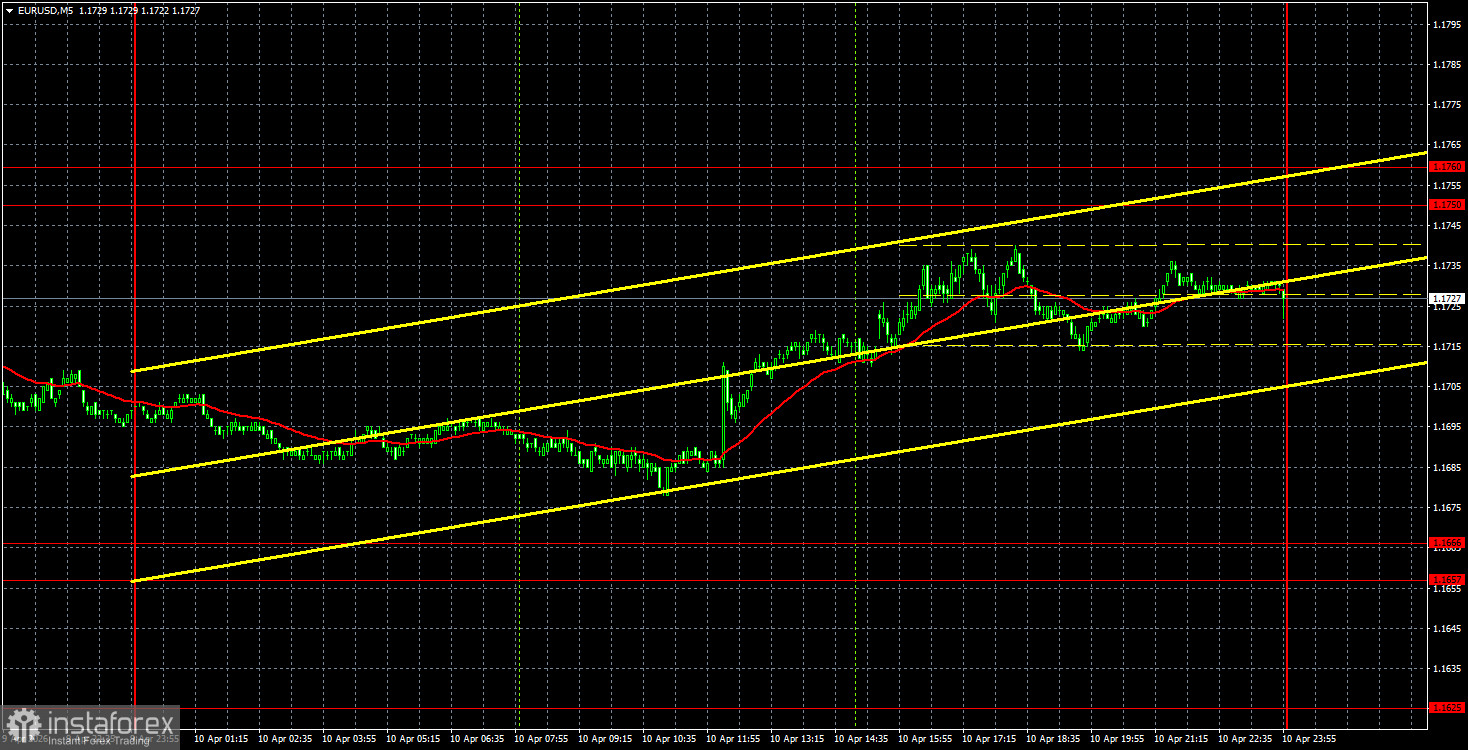
On the 5-minute timeframe, no trading signals were formed on Friday. Thus, there were no grounds for opening trading positions. The last trading signal was formed on Thursday from the rebound off the area of 1.1657-1.1666. Traders could have held long positions throughout Friday.
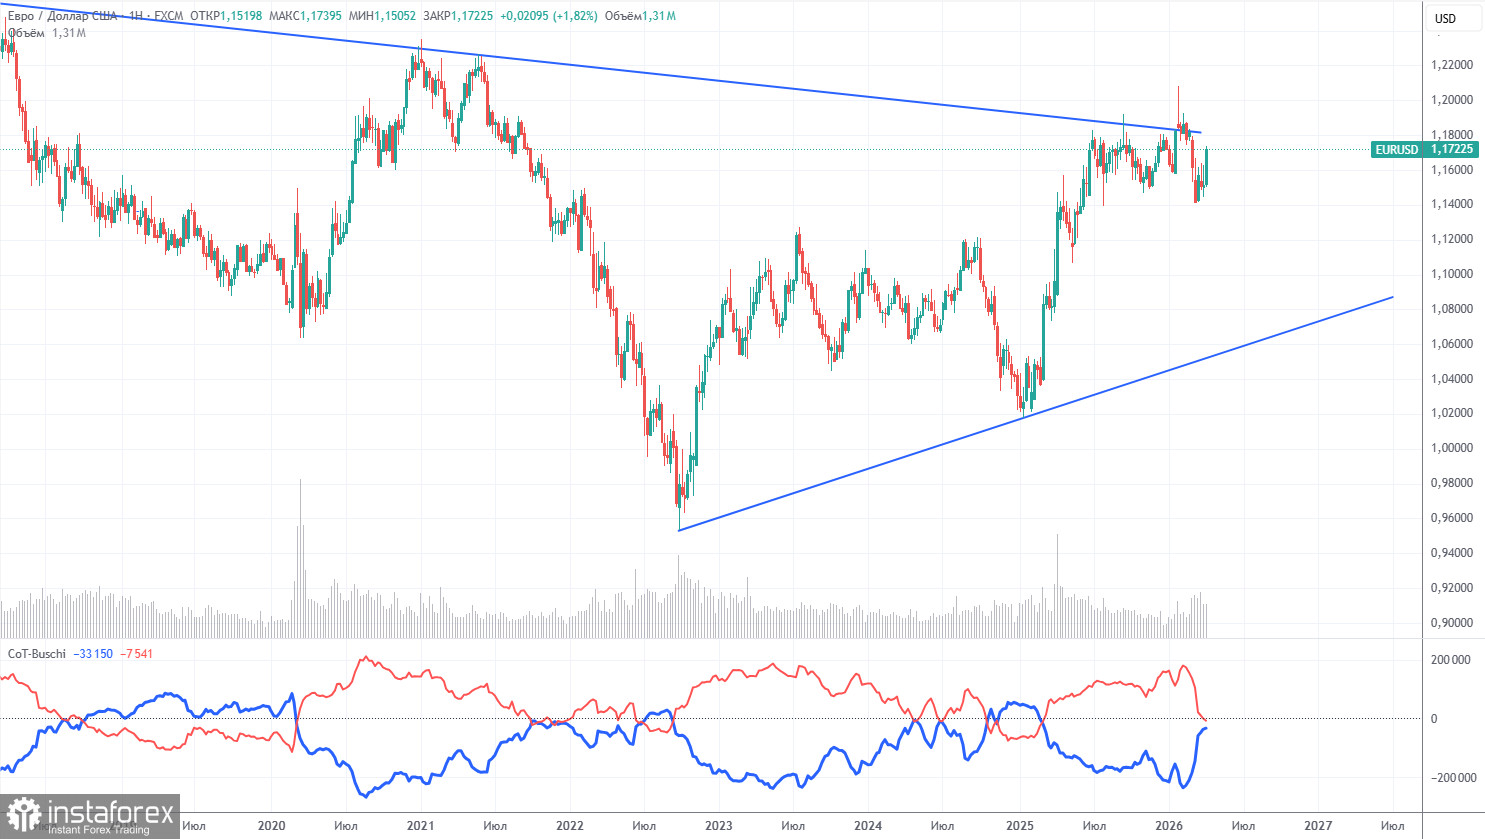
The latest COT report dates back to April 7. The illustration of the weekly timeframe clearly shows that the net position of non-commercial traders remains "bullish," but is rapidly declining amid geopolitical events. Traders are mass-selling the euro in favor of the US dollar. Donald Trump's policies have not changed, but the dollar now serves as a "reserve currency," which explains its high demand.
We still do not see any fundamental factors that would strengthen the euro, while there remain sufficient factors for the American dollar to fall. The war in the Middle East made the dollar temporarily super-attractive, but when this factor reaches its "expiration date," everything will return to where it started. In the long term, the euro could fall even to the level of 1.06 (the trend line), but the upward trend will still remain relevant. At the moment, the pair has not moved significantly away from the descending trend line, which has been broken several times.
The position of the red and blue lines of the indicator indicates parity between bulls and bears. Over the last reporting week, the number of longs among the "Non-commercial" group increased by 800, while the number of shorts increased by 8,800. Accordingly, the net position decreased by another 8,000 contracts over the week.
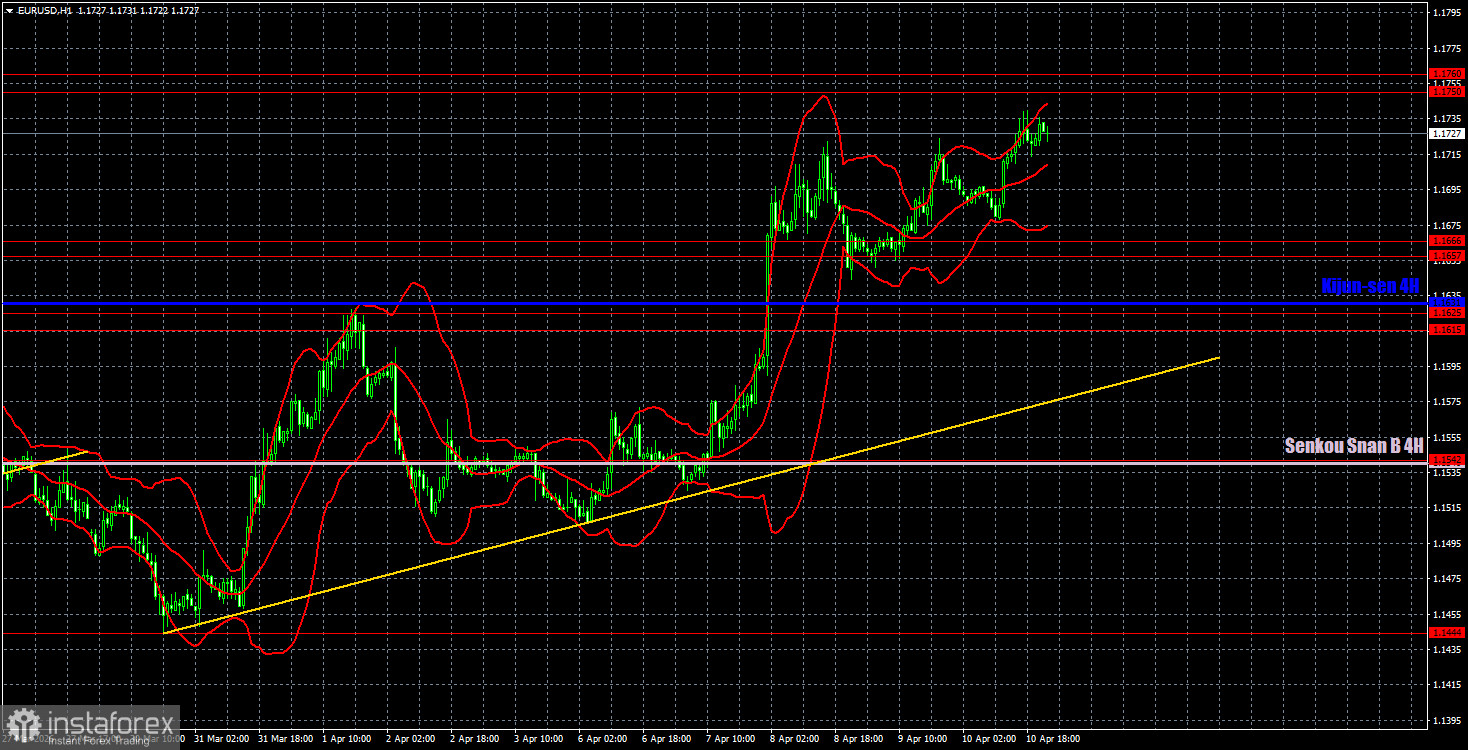
On the hourly timeframe, the EUR/USD pair continues its upward trend. A new escalation in the Middle East may again shift traders' trading priorities, so any upward movement should be approached with caution. In the near future, it is essential to determine whether peace is possible in the Middle East or whether the war will continue. This will determine the dynamics of the EUR/USD pair.
For April 13, we highlight the following levels for trading: 1.1234, 1.1274, 1.1362, 1.1426, 1.1542, 1.1615-1.1625, 1.1657-1.1666, 1.1750-1.1760, 1.1830-1.1837, as well as the Senkou Span B line (1.1542) and the Kijun-sen line (1.1631). The Ichimoku indicator lines may move throughout the day, which should be taken into account when determining trading signals. Don't forget to set a stop-loss order at breakeven if the price moves in the correct direction by 15 pips. This will safeguard against potential losses if the signal turns out to be false.
On Monday, the US will publish a report on existing home sales, but under current circumstances, this is not even a secondary report. On Monday, the market will react to the results of the negotiations in Islamabad, regardless of the outcome.
On Monday, traders may consider short positions if the price rebounds from the 1.1750-1.1760 area, targeting 1.1657-1.1666. Long positions can be held with a target of 1.1750-1.1760, as the price has rebounded from the 1.1657-1.1666 area.
Support and resistance price levels are thick red lines around which the movement may end. They are not sources of trading signals.
The Kijun-sen and Senkou Span B lines are lines of the Ichimoku indicator, transferred to the hourly timeframe from the 4-hour timeframe. They are strong lines.
Extreme levels are thin red lines from which the price previously rebounded. They are sources of trading signals.
Yellow lines are trend lines, trend channels, and any other technical patterns.
Indicator 1 on the COT charts shows the size of the net position of each category of traders.
*The market analysis posted here is meant to increase your awareness, but not to give instructions to make a trade.
InstaSpot analytical reviews will make you fully aware of market trends! Being an InstaSpot client, you are provided with a large number of free services for efficient trading.


