


Our team has over 7,000,000 traders!
Every day we work together to improve trading. We get high results and move forward.
Recognition by millions of traders all over the world is the best appreciation of our work! You made your choice and we will do everything it takes to meet your expectations!
We are a great team together!
InstaSpot. Proud to work for you!


Actor, UFC 6 tournament champion and a true hero!
The man who made himself. The man that goes our way.
The secret behind Taktarov's success is constant movement towards the goal.
Reveal all the sides of your talent!
Discover, try, fail - but never stop!
InstaSpot. Your success story starts here!

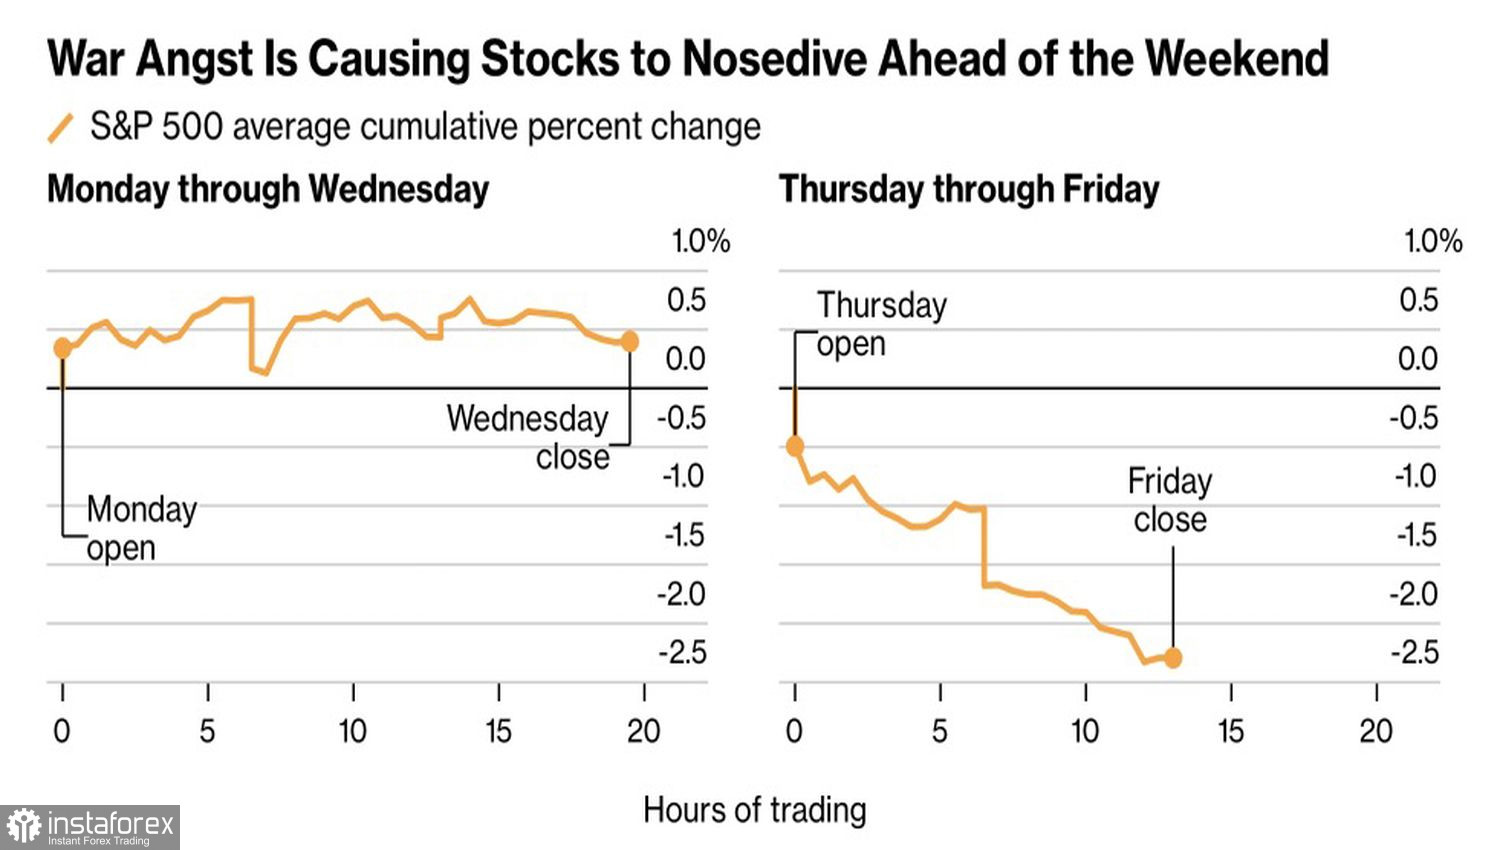
In unpredictable conditions, the market becomes predictable. As the Middle East conflict unfolds, a pattern is emerging in the behavior of US equity indices. The S&P 500 rises at the start of the week, slows in the middle, and goes down on Thursday-Friday. Investors do not want to hold positions over the weekend. Important events can occur in Iran during that time, and Donald Trump repeatedly issues new social media messages capable of rattling markets.
Patterns in S&P 500 dynamics
The US president continues to be a volatile influence on equity indices. Escalatory comments about the Middle East typically come from Donald Trump when markets are closed. His speech about ending the war in Iran was scheduled for the end of the day. Until then, the S&P 500 had been rallying on expectations that the White House would repeat its mantra of a resolution in 2-3 weeks.
That did happen, but simultaneously Trump issued new ultimatums. He promised to send Iran back to the Stone Age by bombing the country's energy infrastructure if the Strait of Hormuz is not opened. Tehran tersely replied that the strait is already open, just not for Americans.
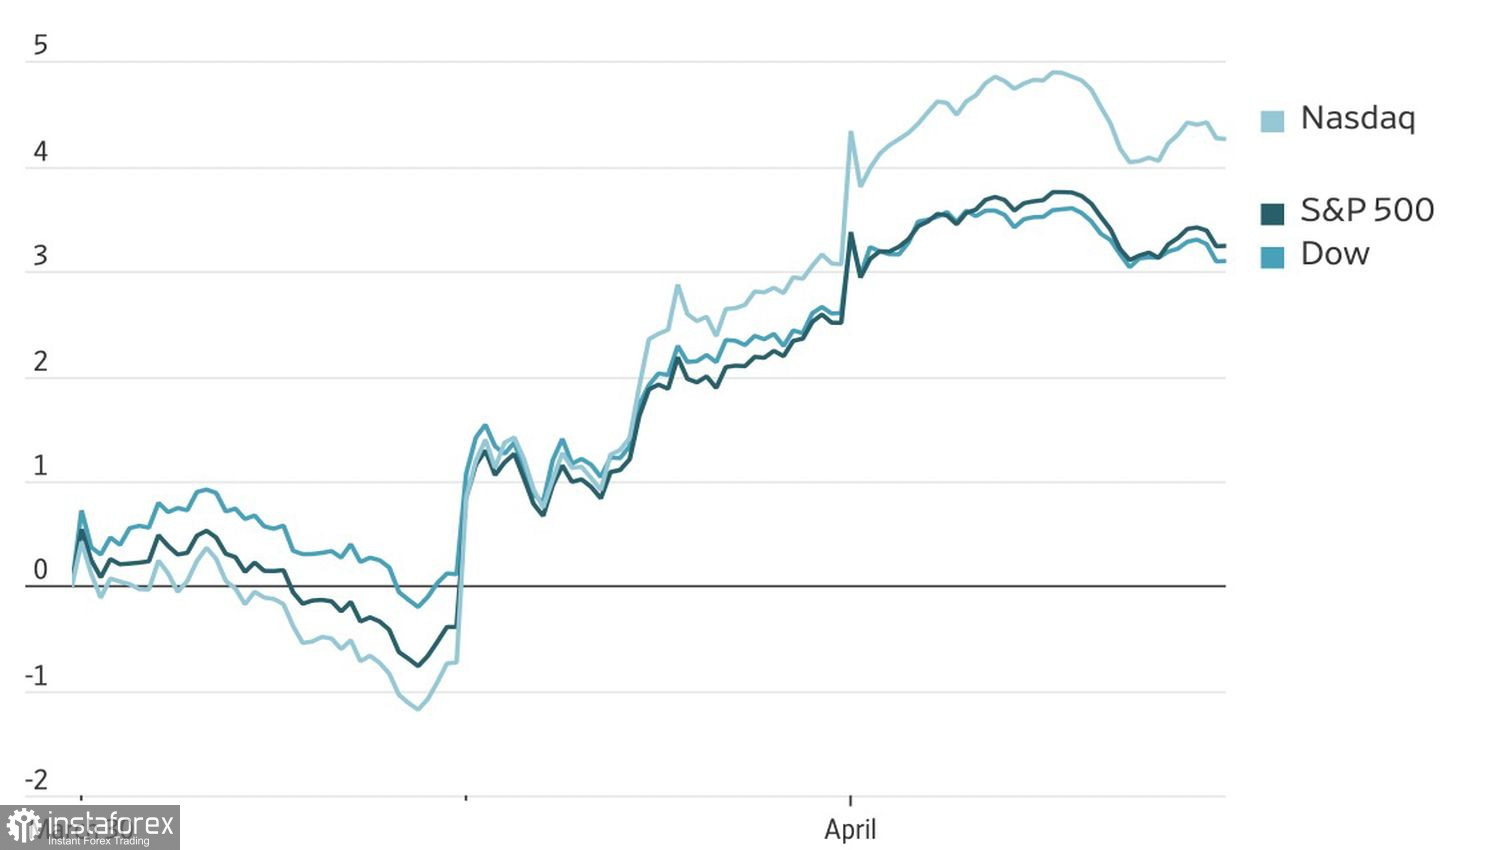
Performance of US equity indices
The White House keeps presenting wishful thinking as fact. Trump imagines Iran's willingness to negotiate or Tehran's pleas for a ceasefire — neither of which the opponent confirms. Iran urges Americans not to trust the rhetoric.
Support for the S&P 500 came from positive US macro data. The Institute for Supply Management reported manufacturing activity rising from 52.4 to 52.7 in March. Retail sales increased 0.6% month-over-month, and ADP private sector employment rose by 62,000. The US economy is resilient, but that fact has taken a back seat.
Investors do not want to miss out on a post-war rally. They recall the sharp rebound in equities after the White House's large-scale tariffs introduced on Liberation Day of America, when the Nasdaq Composite staged an astonishing one-day 10% rally. It is therefore unsurprising that when the scent of good news appears, people quickly take risks.
In that respect, Donald Trump disappointed more than he pleased. Investors expected details after his claim that the Middle East conflict would end in 2-3 weeks. Instead, they received the line that a ceasefire would only be possible once the Strait of Hormuz is reopened. There is no talk of de-escalation, so it is not yet time for FOMO (Fear of Missing Out).
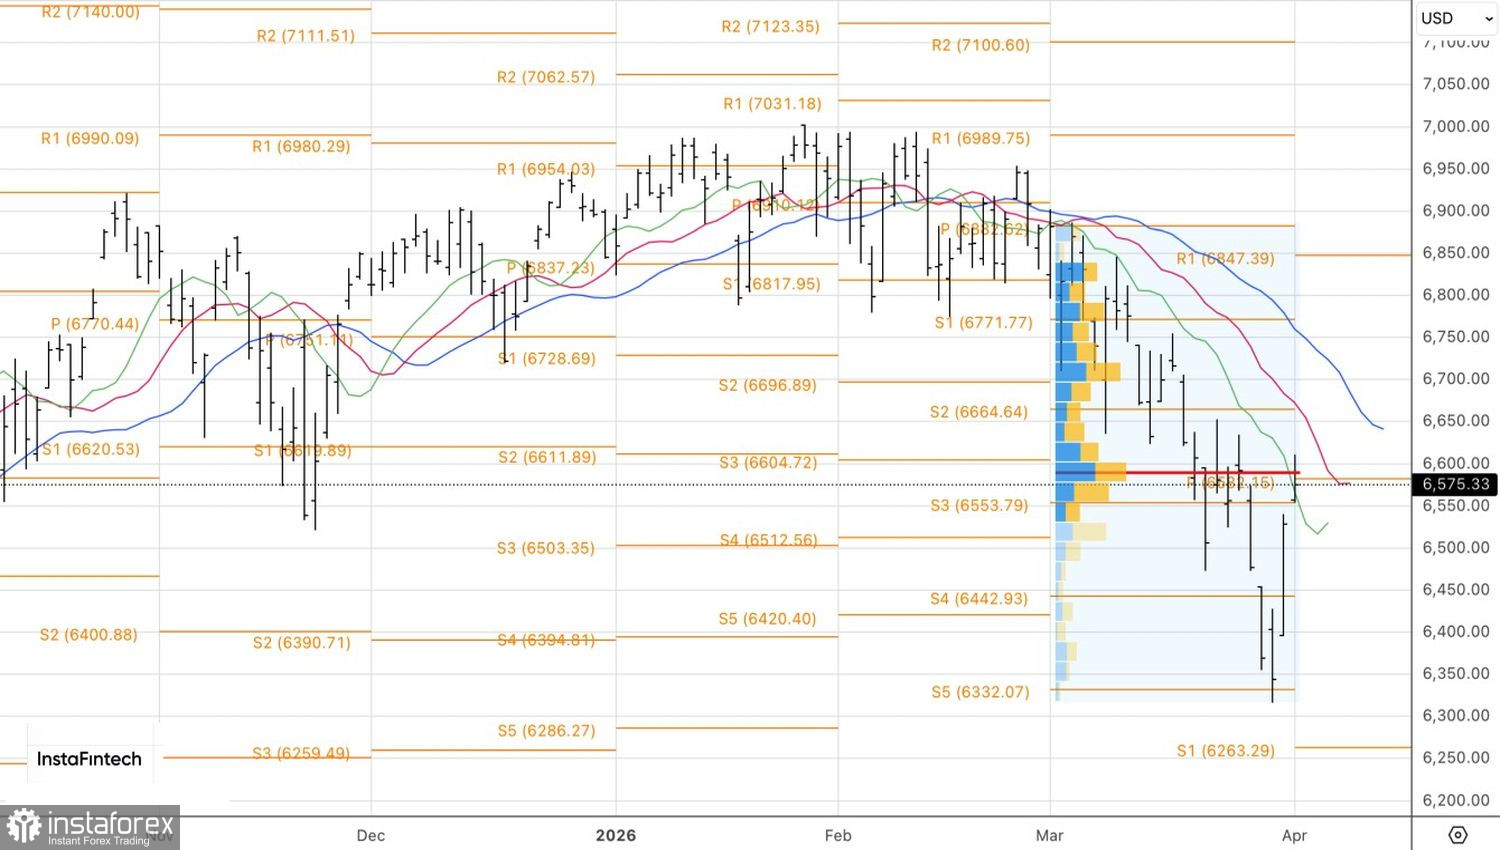
Technically, the S&P 500 printed a doji bar with a long upper shadow on the daily chart and failed to reclaim fair value at 6,585. Both signals point to bull weakness and provide an opportunity to sell the broad index on a break of pivot support at 6,550.
*The market analysis posted here is meant to increase your awareness, but not to give instructions to make a trade.
InstaSpot analytical reviews will make you fully aware of market trends! Being an InstaSpot client, you are provided with a large number of free services for efficient trading.


