


Our team has over 7,000,000 traders!
Every day we work together to improve trading. We get high results and move forward.
Recognition by millions of traders all over the world is the best appreciation of our work! You made your choice and we will do everything it takes to meet your expectations!
We are a great team together!
InstaSpot. Proud to work for you!


Actor, UFC 6 tournament champion and a true hero!
The man who made himself. The man that goes our way.
The secret behind Taktarov's success is constant movement towards the goal.
Reveal all the sides of your talent!
Discover, try, fail - but never stop!
InstaSpot. Your success story starts here!

The GBP/USD pair experienced a sharp decline on Friday that was not driven by geopolitics, fundamentals, or macroeconomic factors. No significant events were scheduled for the last trading day of the previous week, and there were no discouraging reports from the "Iran front." Thus, the British pound fell without any apparent reason. Furthermore, just a day earlier, the Bank of England had decided to keep the key rate unchanged but adopted a much less dovish stance than before. If the British central bank had been prepared for further easing of monetary policy before the war in Iran, it now seems ready to tighten amid rising energy prices, which will certainly provoke inflation. As mentioned, the Fed is not ready to raise the key rate, while the BoE and the European Central Bank are prepared to do so. However, support for the euro and pound was only seen on Thursday, and by Friday, everything had returned to the previous levels.
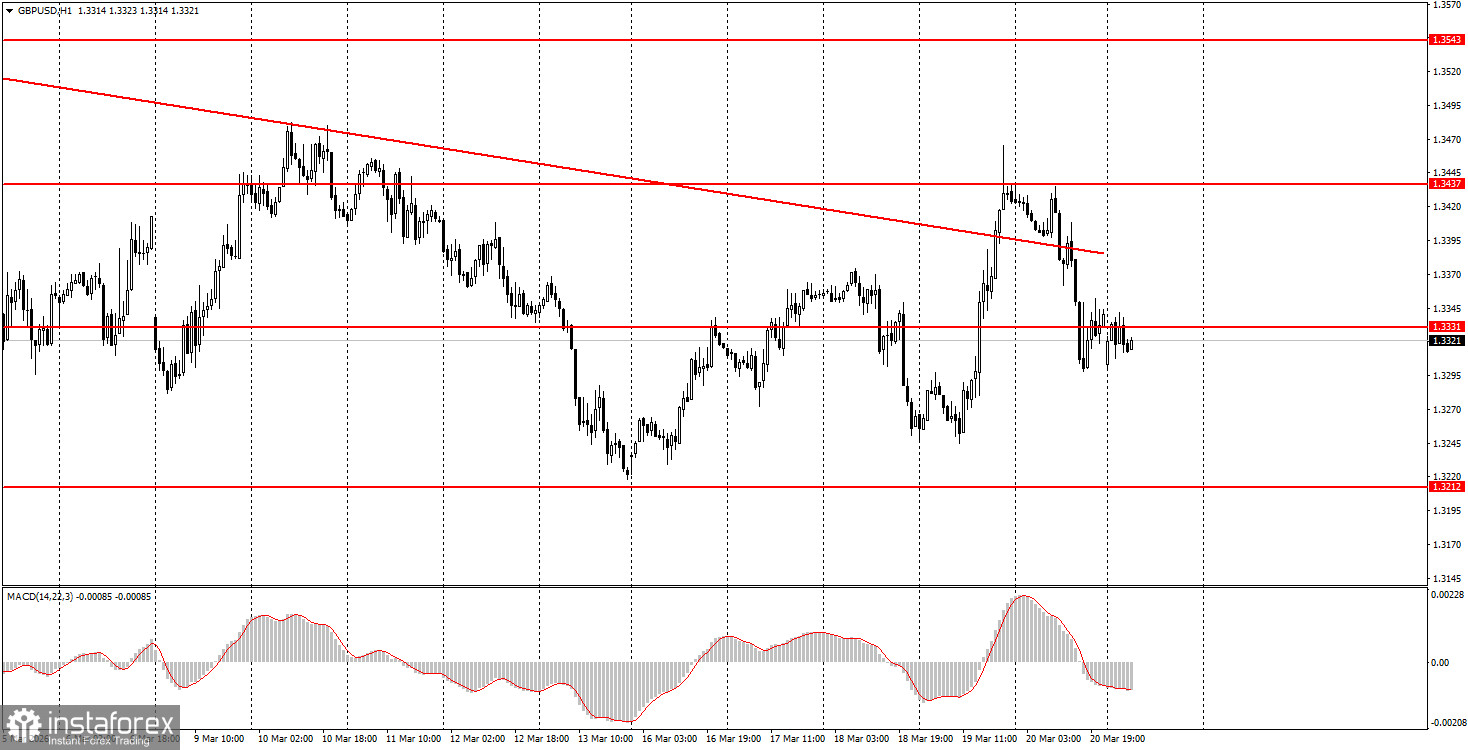
On the hourly timeframe, the GBP/USD pair may finally start forming an upward trend. There are no global factors driving medium-term dollar growth, so in 2026, we expect the resumption of the global upward trend from 2025, which could drive the pair to at least 1.4000. In recent weeks, the market has been entirely focused on the war in the Middle East, but this factor cannot indefinitely support the dollar, which currently has no other factors to rely on.
On Monday, beginner traders may open short positions if the price consolidates below the 1.3319-1.3331 area, targeting 1.3259-1.3267. If the price consolidates above the 1.3319-1.3331 area, long positions can be opened with a target of 1.3403-1.3407.
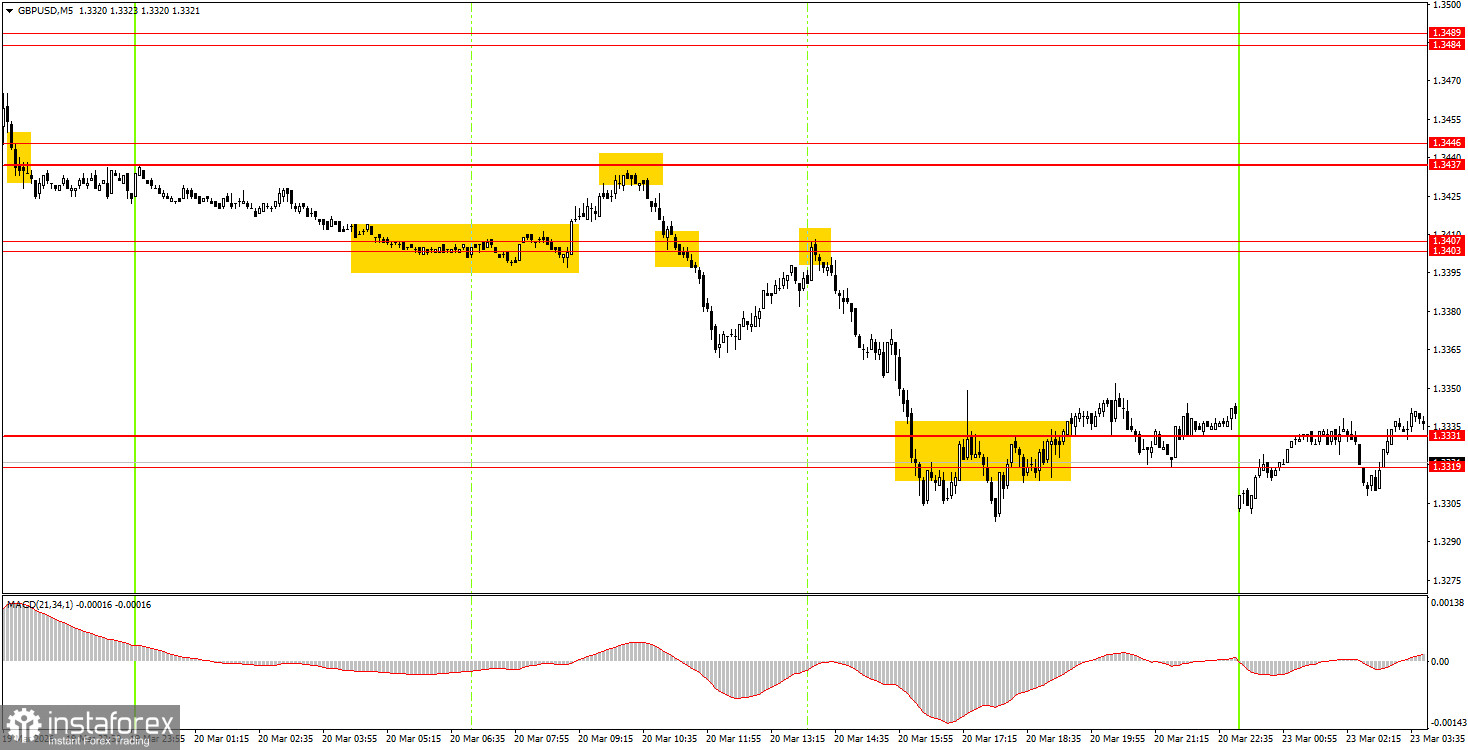
On the 5-minute timeframe, trading can currently focus on the following levels: 1.3096-1.3107, 1.3203-1.3212, 1.3259-1.3267, 1.3319-1.3331, 1.3403-1.3407, 1.3437-1.3446, 1.3484-1.3489, 1.3529-1.3543, 1.3643-1.3652, 1.3695, 1.3741-1.3751. No significant events or reports are scheduled for Monday in the UK or the US; therefore, traders will have nothing to react to during the day.
Price levels of support and resistance are levels that serve as targets when opening buys or sells. Take Profit levels can be placed around them.
Red lines represent channels or trend lines that show the current trend and indicate the direction in which it is preferable to trade now.
The MACD indicator (14,22,3) – the histogram and the signal line – is a supporting indicator that can also be used as a source of signals.
Important speeches and reports (always included in the news calendar) can significantly affect the movement of the currency pair. Therefore, during their release, trading should be done with utmost caution, or traders should exit the market to avoid sharp price reversals against the previous movement.
Beginning traders in the forex market should remember that not every trade can be profitable. Developing a clear strategy and effective money management are the keys to long-term trading success.
*The market analysis posted here is meant to increase your awareness, but not to give instructions to make a trade.
InstaSpot analytical reviews will make you fully aware of market trends! Being an InstaSpot client, you are provided with a large number of free services for efficient trading.


