


The legend in the InstaSpot team!
Legend! You think that's bombastic rhetoric? But how should we call a man, who became the first Asian to win the junior world chess championship at 18 and who became the first Indian Grandmaster at 19? That was the start of a hard path to the World Champion title for Viswanathan Anand, the man who became a part of history of chess forever. Now one more legend in the InstaSpot team!


Borussia is one of the most titled football clubs in Germany, which has repeatedly proved to fans: the spirit of competition and leadership will certainly lead to success. Trade in the same way that sports professionals play the game: confidently and actively. Keep a "pass" from Borussia FC and be in the lead with InstaSpot!

The EUR/USD currency pair corrected on Friday to the Kijun-sen and Senkou Span B lines, and the European currency was fortunate that these lines prevented it from falling further. On Friday, there were no significant reasons for the euro to decline or for the US dollar to rise, but the market once again demonstrated that almost all fundamental and macroeconomic factors are currently of little importance. On Thursday, the European currency surged in response to the ECB's hawkish rhetoric, but by Friday, it fell for no apparent reason. However, there is still a chance of at least a correction in the euro. These chances could evaporate quickly if Donald Trump orders a missile strike on Iran's energy sector on Monday.
From a technical standpoint, an upward trend is forming on the hourly timeframe, but it could end at any moment under geopolitical pressure. Over the past one and a half months, we have repeatedly observed situations in which the price breaks through a descending trend line, then falls back. Given that the situation in the Middle East is not improving, traders might see the same pattern this time.
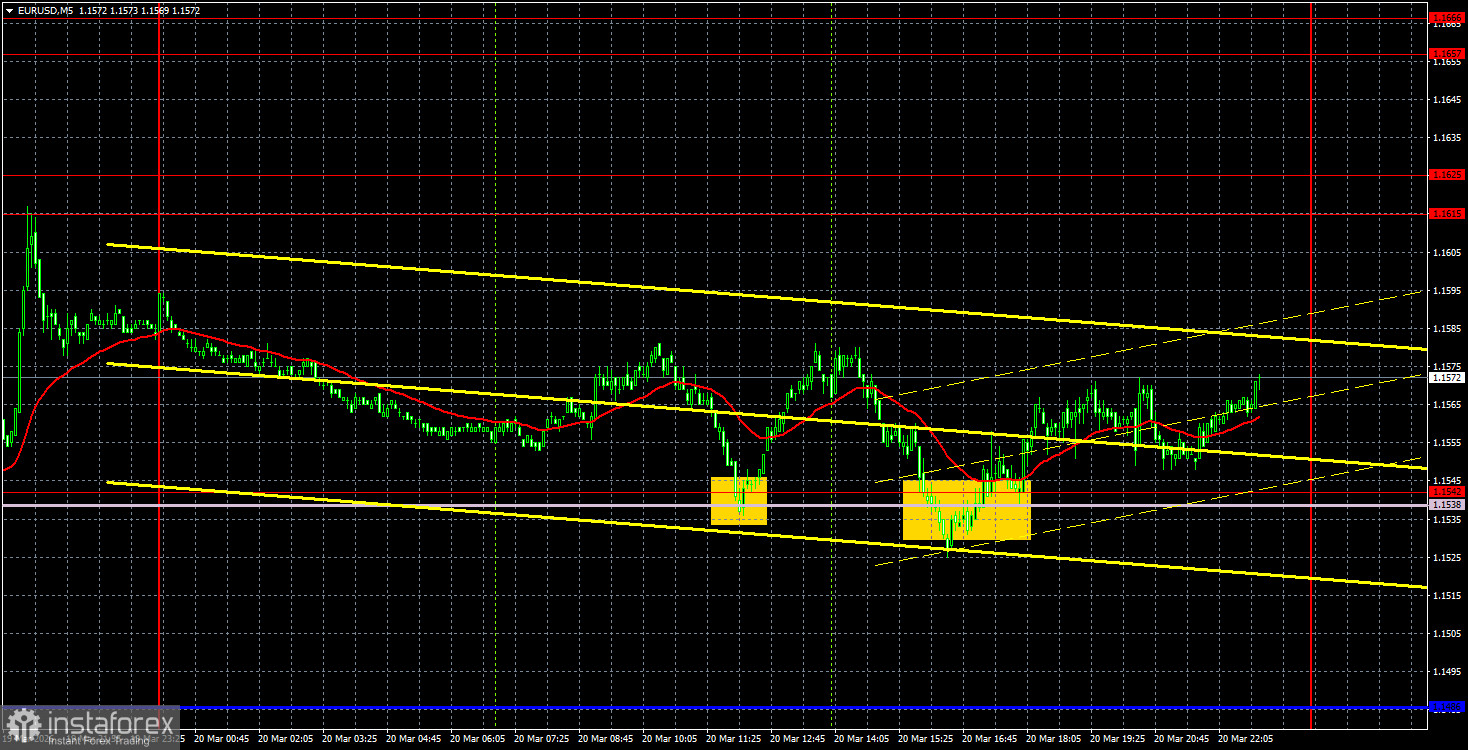
On the 5-minute timeframe on Friday, two buy signals were formed, and it is clear that the Ichimoku indicator lines held the euro from falling. The British pound, meanwhile, was in active decline. The European currency traded more sideways throughout the day rather than up or down. Both trading signals could have been acted on, but they did not yield high profits. However, there were no losses either.
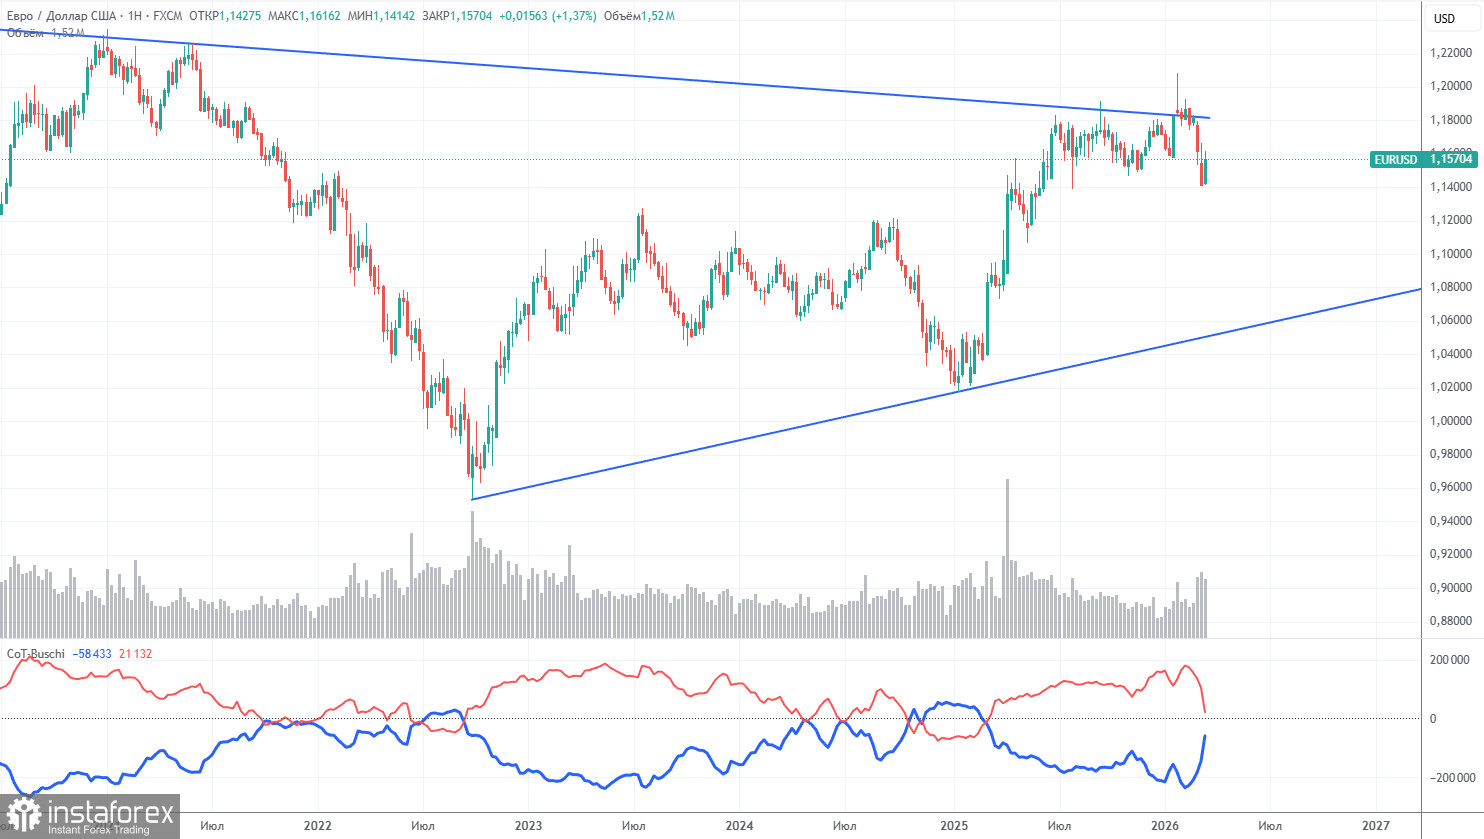
The latest COT report is dated March 17. In the illustration of the weekly timeframe, it is clear that the net position of non-commercial traders remains "bullish" but is rapidly declining due to geopolitical events at the beginning of 2026. Traders are massively getting rid of the euro in favor of the US dollar. Trump's policies have not changed, but the dollar is once again acting as a "reserve currency," which accounts for the sharp influx of buyers.
We still do not see any fundamental factors that would strengthen the European currency. Instead, there are enough factors for the US dollar's decline. The war in the Middle East has made the dollar temporarily super attractive, but when this factor expires, everything could return to normal. In the long term, the euro could fall to as low as 1.06 (trend line), but the upward trend will still remain relevant.
The positioning of the red and blue lines of the indicator continues to indicate the preservation of a "bullish" trend. During the last reporting week, the number of longs for the "Non-commercial" group decreased by 52,800, while the number of shorts increased by 31,200. Consequently, the net position decreased by 84,000 contracts over the week.
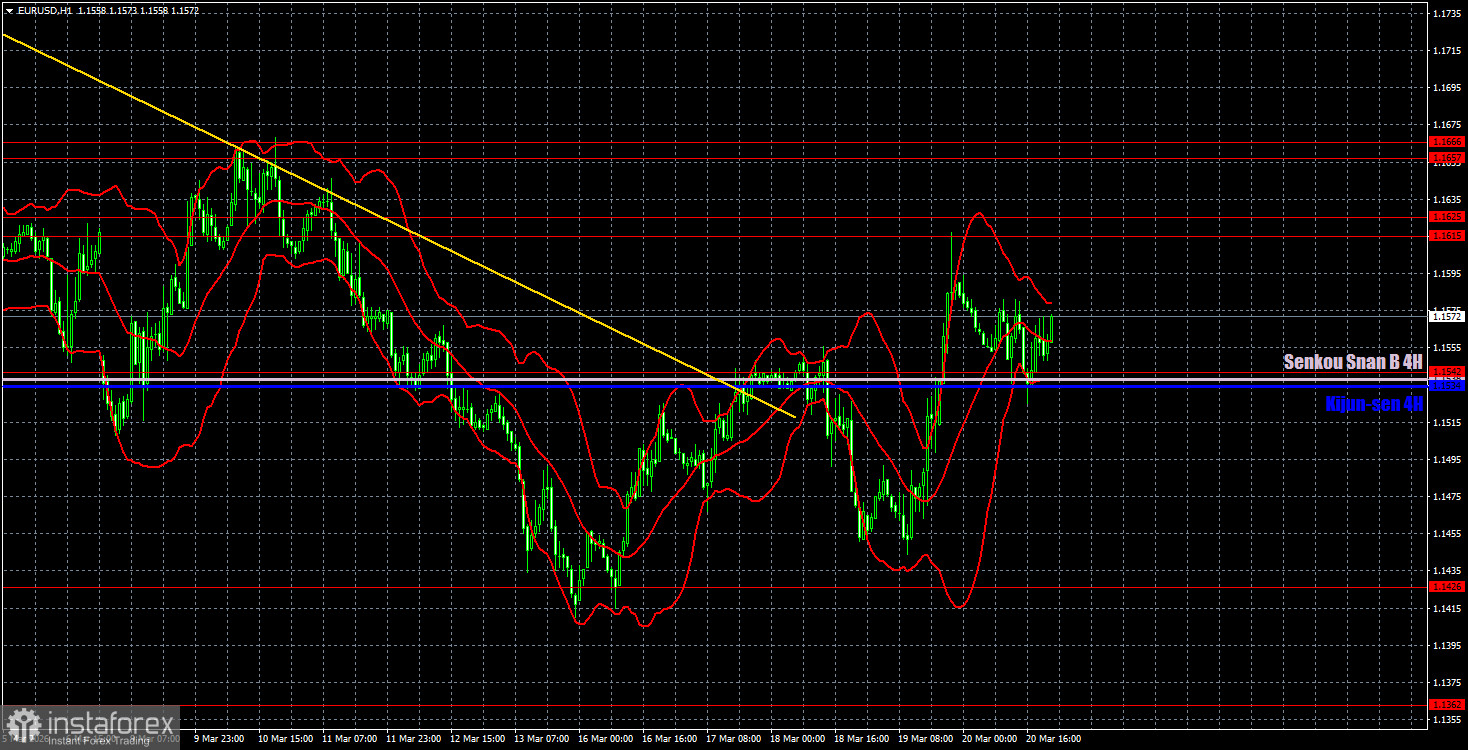
On the hourly timeframe, the EUR/USD pair could have completed its downward trend last week, but there is currently no confidence in this. A new escalation in the Middle East, new shocks in the oil or gas markets, or the expansion of the conflict beyond the Middle East could provoke a new wave of dollar buying. The European currency rose sharply on Thursday, but is the market ready to start a new trend?
For March 23, we highlight the following trading levels — 1.1234, 1.1274, 1.1362, 1.1426, 1.1542, 1.1615-1.1625, 1.1657-1.1666, 1.1750-1.1760, 1.1830-1.1837, as well as the Senkou Span B line (1.1538) and Kijun-sen line (1.1534). The Ichimoku indicator lines may shift throughout the day, which should be taken into account when determining trading signals. Don't forget to place your Stop Loss order at breakeven if the price moves in the right direction by 15 pips. This will protect you from potential losses if the signal turns out to be false.
On Monday, there are no important events or reports scheduled in the European Union or the US. Therefore, throughout the day, traders will only be able to react to geopolitical events. We hope there won't be any, but the European currency already showed its weakness on Friday and its inability to continue rising.
On Monday, traders may consider short positions if the price consolidates below the Senkou Span B line, targeting 1.1426 and 1.1326. Long positions can be left open with a target in the range of 1.1615-1.1625, as the price rebounded off the Ichimoku indicator lines twice on Friday.
Support and resistance price levels – thick red lines near which movement may end. They are not sources of trading signals.
Kijun-sen and Senkou Span B lines – lines of the Ichimoku indicator transferred to the hourly timeframe from the 4-hour timeframe. They are strong lines.
Extreme levels – thin red lines from which the price has previously bounced. They are sources of trading signals.
Yellow lines – trend lines, trend channels, and any other technical patterns.
Indicator 1 on COT charts – the size of the net position for each category of traders.
*The market analysis posted here is meant to increase your awareness, but not to give instructions to make a trade.
InstaSpot analytical reviews will make you fully aware of market trends! Being an InstaSpot client, you are provided with a large number of free services for efficient trading.


