


Our team has over 7,000,000 traders!
Every day we work together to improve trading. We get high results and move forward.
Recognition by millions of traders all over the world is the best appreciation of our work! You made your choice and we will do everything it takes to meet your expectations!
We are a great team together!
InstaSpot. Proud to work for you!


Actor, UFC 6 tournament champion and a true hero!
The man who made himself. The man that goes our way.
The secret behind Taktarov's success is constant movement towards the goal.
Reveal all the sides of your talent!
Discover, try, fail - but never stop!
InstaSpot. Your success story starts here!

The GBP/USD currency pair showed a slight recovery on Monday, which, under certain circumstances, could even mark the start of a new upward trend. It is important to note that we do not consider the upward trends in the euro and pound, which began in 2022 and 2025, as definitively completed. Over the past month, geopolitics has greatly assisted the dollar, but it will not support it forever. Sooner or later, the market will shift its focus to other factors. Among the other factors favorable to the dollar, there are none. As a result, we have observed a significant decline in the British currency over the last 4-6 weeks, which could easily have been avoided. But going forward, what will support the continued rise of the American currency? Of course, if the situation in the Middle East worsens further than it already is, a new rise in the dollar is quite possible. However, it seems that the market has already accounted for all the most negative scenarios.
From a technical standpoint, the hourly timeframe continues its downward trend, raising no questions. The price is below the Ichimoku indicator lines and the trend line. Thus, before breaking through all three lines, it is difficult to speak of the beginning of a new trend. The growth of the British currency on Monday, without support from fundamentals or macroeconomic factors, is a good sign, but it may very well be a simple correction.
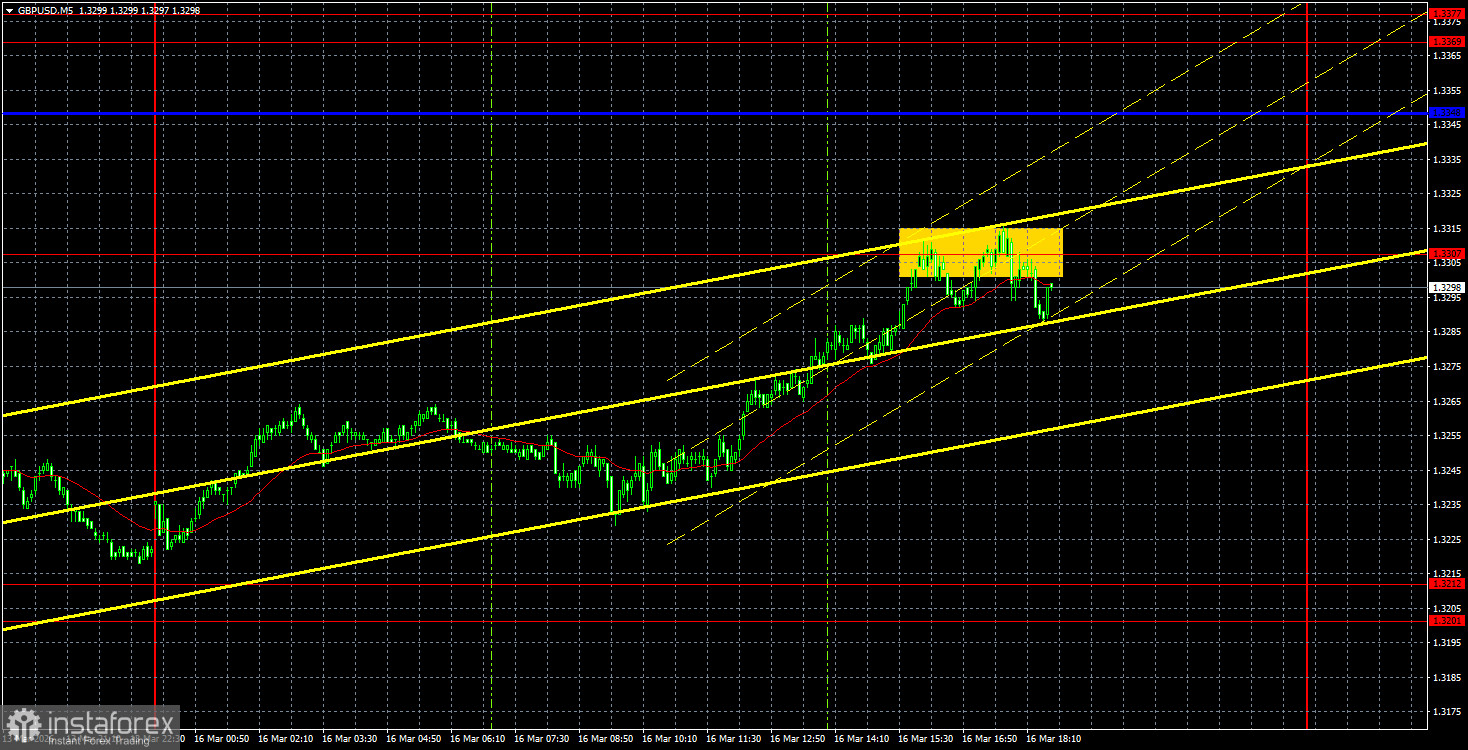
On the 5-minute timeframe, the first trading signals were formed only in the evening. Unfortunately, the price did not form a buy signal in the 1.3201-1.3212 area, missing it by just a few points. However, in any case, this signal would have formed at the intersection of Friday and Monday, making it extremely difficult to exploit.
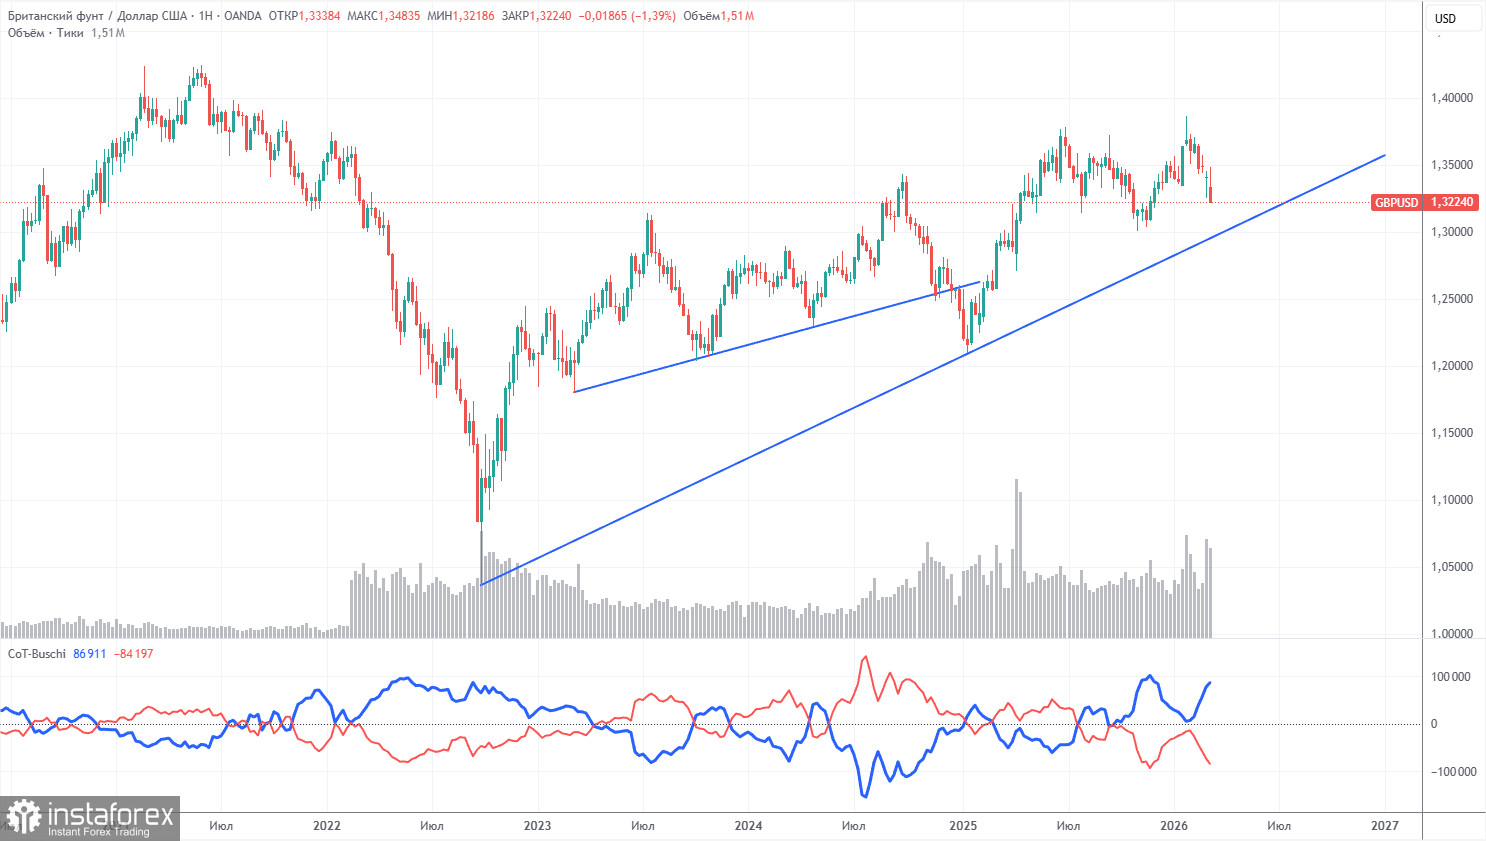
COT reports for the British pound show that, in recent years, commercial traders' sentiment has continually changed. The red and blue lines, reflecting the net positions of commercial and non-commercial traders, frequently cross and are mostly near the zero mark. Currently, the lines are diverging, with non-commercial traders still dominating with... sales. However, considering the events in the Middle East, it is not surprising that demand for riskier currencies is falling while demand for the dollar is rising.
In the long term, the dollar continues to decline due to Donald Trump's policies, as shown clearly on the weekly timeframe (illustration above). The trade war will continue in one form or another for a long time, and the Fed will, in any case, lower rates within the next 12 months. Demand for the dollar will decline one way or another. However, geopolitical factors currently take precedence, providing strong support for the American currency. According to the last COT report (dated March 10) on the British pound, the "Non-commercial" group closed 10,200 BUY contracts and opened 1,200 SELL contracts. Thus, the net position of non-commercial traders decreased by another 11,400 contracts over the week.
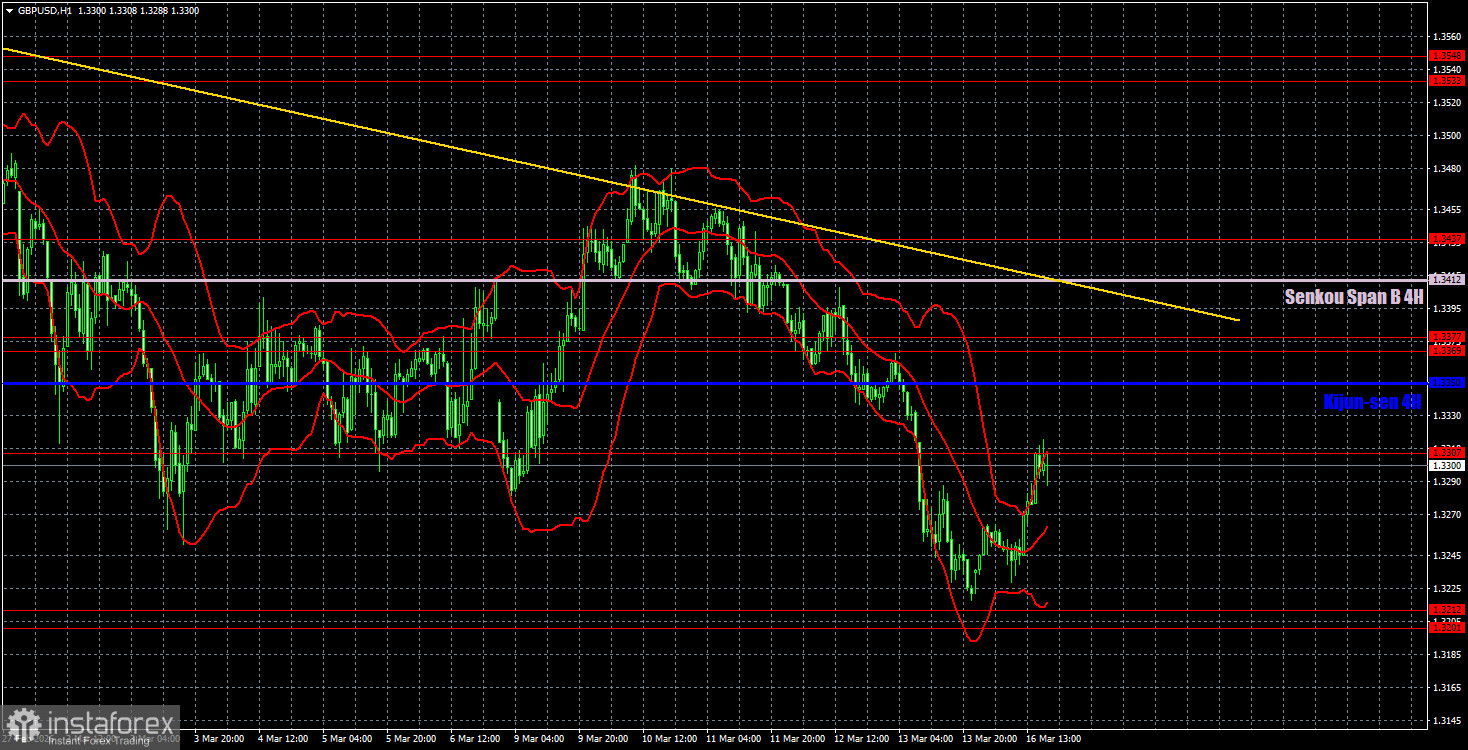
On the hourly timeframe, the GBP/USD pair could have transitioned to forming an upward trend long ago, but geopolitics continues to pull the British pound down. Despite the significant decline in the pair in February-March, we still regard it as a correction. The daily timeframe confidently signals the preservation of an upward trend. Unfortunately, geopolitics is very unpredictable and can overshadow all other factors.
For March 17, we highlight the following important levels: 1.3096-1.3115, 1.3201-1.3212, 1.3307, 1.3369-1.3377, 1.3437, 1.3533-1.3548, 1.3615, 1.3671-1.3681, 1.3751-1.3763. The Senkou Span B line (1.3412) and Kijun-sen (1.3350) may also serve as sources of signals. It is recommended to set the Stop Loss level to break even once the price has moved 20 pips in the right direction. The Ichimoku indicator lines may move throughout the day, which should be taken into account when determining trading signals.
On Tuesday, there are no important events or reports scheduled in the UK, while the US will only see the weekly ADP employment report released. It is worth noting that this report has recently been issued in two variations: monthly and weekly. The market has always been indifferent to the more significant monthly variant. Therefore, the weekly variant is not even a secondary but a tertiary indicator.
On Tuesday, traders may consider new short positions targeting 1.3201-1.3212 if the pair consolidates below 1.3307 or bounces off the critical line. Long positions become relevant with targets at 1.3350, 1.3369-1.3377, and 1.3412 if the price consolidates above 1.3307.
Support and resistance price levels – thick red lines around which movement may come to an end. They are not sources of trading signals.
Kijun-sen and Senkou Span B lines – Ichimoku indicator lines transferred to the hourly timeframe from the 4-hour timeframe. They are strong lines.
Extreme levels – thin red lines from which the price previously rebounded. They are sources of trading signals.
Yellow lines – trend lines, trend channels, and any other technical patterns.
Indicator 1 on COT charts – the size of the net position of each category of traders.
*The market analysis posted here is meant to increase your awareness, but not to give instructions to make a trade.
InstaSpot analytical reviews will make you fully aware of market trends! Being an InstaSpot client, you are provided with a large number of free services for efficient trading.


