


Our team has over 7,000,000 traders!
Every day we work together to improve trading. We get high results and move forward.
Recognition by millions of traders all over the world is the best appreciation of our work! You made your choice and we will do everything it takes to meet your expectations!
We are a great team together!
InstaSpot. Proud to work for you!


Actor, UFC 6 tournament champion and a true hero!
The man who made himself. The man that goes our way.
The secret behind Taktarov's success is constant movement towards the goal.
Reveal all the sides of your talent!
Discover, try, fail - but never stop!
InstaSpot. Your success story starts here!

Bitcoin continues to decline after a sell signal was formed on the daily timeframe, which we have been waiting for about a month. In general, it can already be said that traders who opened short positions based on our recommendations are in profit. Of course, the final profit depends on where the trade is closed, and finding the optimal entry point is no less important in trading than finding the optimal exit point. At present, the price has broken the ascending trendline, which we consider a "liquidity pool." Some stop-loss orders and pending sell orders have already been "eaten." The decline has stopped, and the market seems to be showing traders that the breakout is false. However, we believe that the breakout is not false and that the decline in Bitcoin will continue.
Overall, there are currently no technical grounds to expect Bitcoin to grow. Even on the 4-hour timeframe, "bearish" FVGs are being formed that remain relevant. Thus, the price may respond to the nearest FVG pattern and resume its decline. The minimum target for Bitcoin's decline in the medium term is $70,800. Throughout 2026, we anticipate even sharper declines for the world's first cryptocurrency. Regarding the influence of macroeconomic and fundamental factors, all markets are currently in a state of confusion. Events in the new year are unfolding rapidly, and many are so contradictory that traders simply ignore them. For example, yesterday Donald Trump reversed his decision to impose tariffs on the UK and the EU, which he announced last weekend. The issue with Greenland, according to Trump, was resolved with Mark Rutte, the NATO Secretary General, but the topics concerning Iran, Latin American countries, and Jerome Powell remain relevant. Yesterday's U.S. GDP report was ignored by the market. And that was the most important report of Thursday.
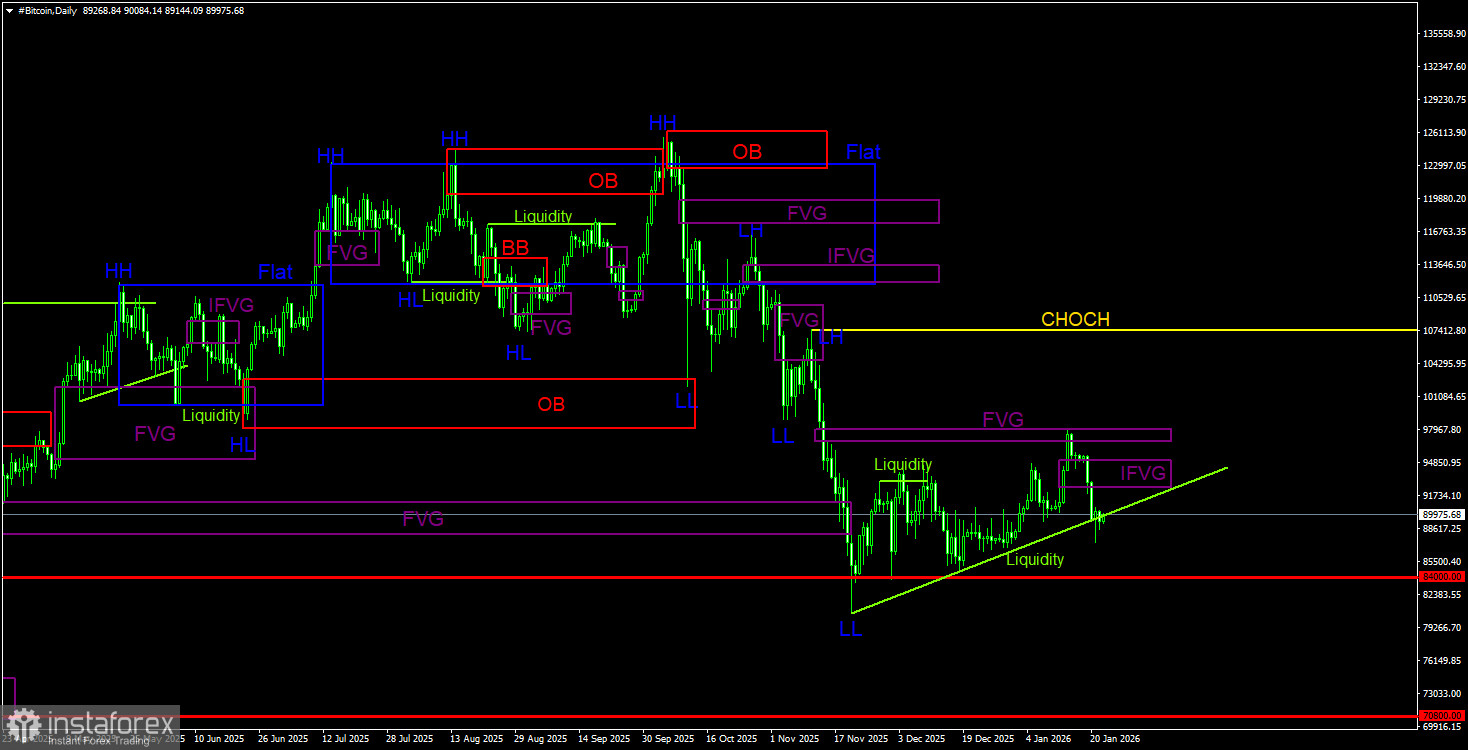
On the daily timeframe, Bitcoin continues to form a downward trend, and the correction may already be complete. The trend structure is identified as downward, and the CHOCH line is currently at the level of $107,300. Only above this level can we consider the downward trend to be complete. In 2026, Bitcoin could fall to as low as $60,000, from where it started its last rise. The only area of POI for sales was the "bearish" FVG, which has already seen a response. A trading signal has been formed, and confirmation has been received. The target for the new round of declining movement may be the $70,800 – 50.0% Fibonacci level. The "bullish" FVG has transformed into a "bearish" IFVG, which is now a new area of POI for sales.
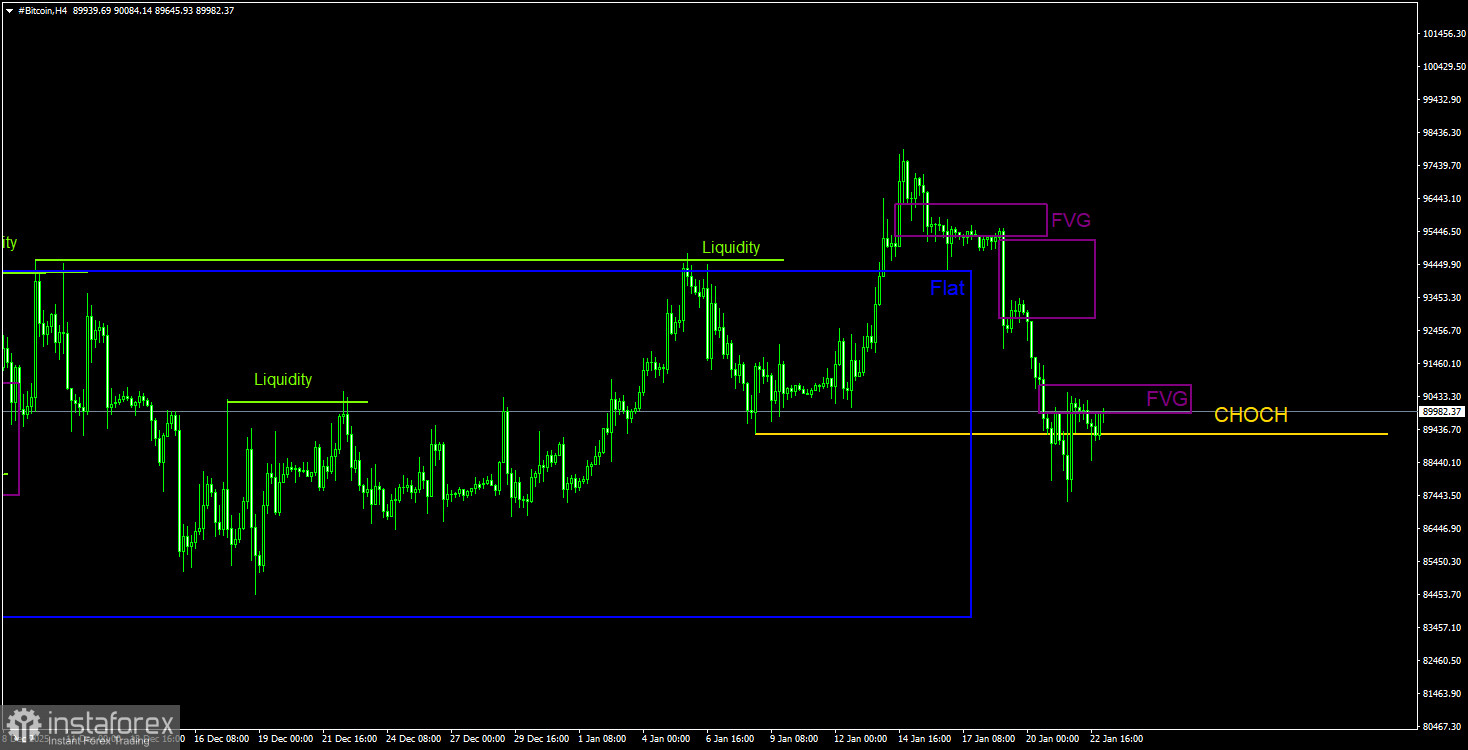
On the 4-hour timeframe, the price has broken out of the sideways channel it spent a month and a half in. However, the Bitcoin rally was short-lived, as the "bearish" FVG pattern on the daily timeframe was confirmed. The upward structure on the 4-hour timeframe has been broken, and several "bearish" FVGs have been formed in recent days. Given the picture on the daily timeframe, we assume that the decline will continue, and all nearby "bearish" patterns can be used to open new short positions.
On the 4-hour timeframe, the price has broken out of the sideways channel it spent a month and a half in. However, the Bitcoin rally was short-lived, as the "bearish" FVG pattern on the daily timeframe was confirmed. The upward structure on the 4-hour timeframe has been broken, and several "bearish" FVGs have been formed in recent days. Given the picture on the daily timeframe, we assume that the decline will continue, and all nearby "bearish" patterns can be used to open new short positions.
CHOCH – change of character / break of trend structure.
Liquidity – liquidity; traders' Stop Loss orders that market makers use to accumulate their positions.
FVG – Fair Value Gap / area of price inefficiency. Price moves very quickly through such areas, indicating a complete absence of one side of the market. Subsequently, the price tends to return and receive a reaction from such areas.
IFVG – Inverted Fair Value Gap. After returning to such an area, the price does not receive a reaction but impulsively breaks through it and then tests it from the other side.
OB – Order Block. The candle on which a market maker opened a position to take liquidity and form their own position in the opposite direction.
*The market analysis posted here is meant to increase your awareness, but not to give instructions to make a trade.
InstaSpot analytical reviews will make you fully aware of market trends! Being an InstaSpot client, you are provided with a large number of free services for efficient trading.


