


The legend in the InstaSpot team!
Legend! You think that's bombastic rhetoric? But how should we call a man, who became the first Asian to win the junior world chess championship at 18 and who became the first Indian Grandmaster at 19? That was the start of a hard path to the World Champion title for Viswanathan Anand, the man who became a part of history of chess forever. Now one more legend in the InstaSpot team!


Borussia is one of the most titled football clubs in Germany, which has repeatedly proved to fans: the spirit of competition and leadership will certainly lead to success. Trade in the same way that sports professionals play the game: confidently and actively. Keep a "pass" from Borussia FC and be in the lead with InstaSpot!

EUR/USD
Analysis:
In the short term, the direction of the euro's price movement in the major pair has been shaped by an upward wave since February. Over the past six months, the pair has been forming a corrective section of the (B) wave pattern, which remains unfinished. The wave has the form of a contracting flat. The quotes are moving along the boundaries of a potentially reversal zone on the larger timeframe.
Forecast:
At the beginning of the upcoming week, the European currency is expected to continue its sideways movement. Near the support zone, price fluctuations may transition into a horizontal formation. A reversal and the start of an upward price trend are more likely in the second half of the week. Important economic news could serve as a timing guide.

Potential Reversal Zones
Resistance:
Support:
Recommendations:
USD/JPY
Analysis:
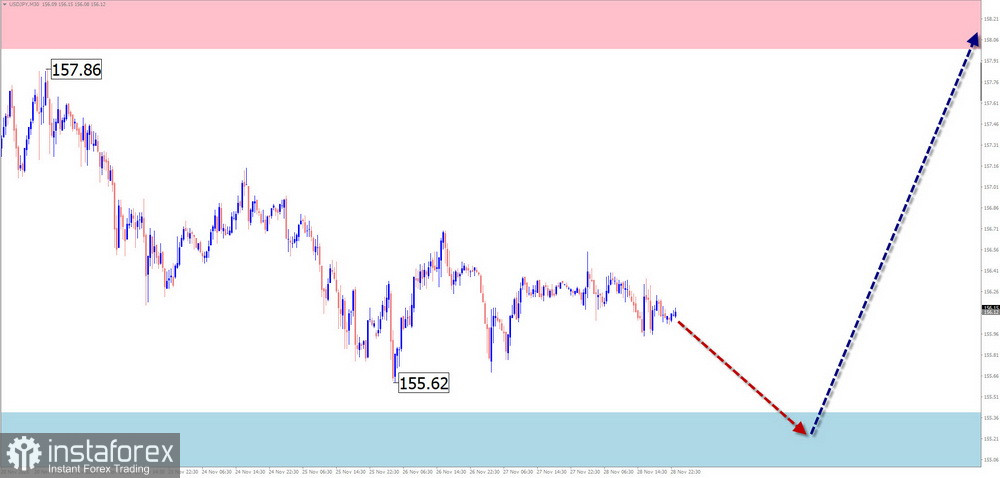
On the chart of the Japanese yen major pair, the short-term trend is dominated by an upward movement. Its unfinished final segment has been developing since October 1. Prices have entered the boundaries of a potential reversal zone on the weekly timeframe, nearing its upper edge. The downward segment from November 20 carries reversal potential.
Forecast:
In the coming week, price movement downward is expected, possibly reaching the calculated support zone. After that, a sideways trend is likely. The probability of a trend reversal and a renewed rise in the pair increases afterward. The calculated resistance area shows the potential upper boundary of the weekly price movement.
Potential Reversal Zones
Resistance:
Support:
Recommendations:
Bitcoin
Brief analysis:
On the weekly Bitcoin chart, the trend direction over recent years has been shaped by an upward wave zigzag. Since November of last year, prices have been undergoing a correction, forming an extended flat. The final section (C) is currently developing. The upper boundary of the monthly timeframe's potential reversal zone lies at the 75K level.
Forecast:
In the coming days, the upward vector of Bitcoin's price movement is highly likely to continue. Temporary pressure on the upper resistance boundary cannot be ruled out. After that, a reversal and renewed decline are expected. The support zone marks the upper boundary of the anticipated target area.

Potential Reversal Zones
Resistance:
Support:
Recommendations:
Ethereum
Brief analysis:
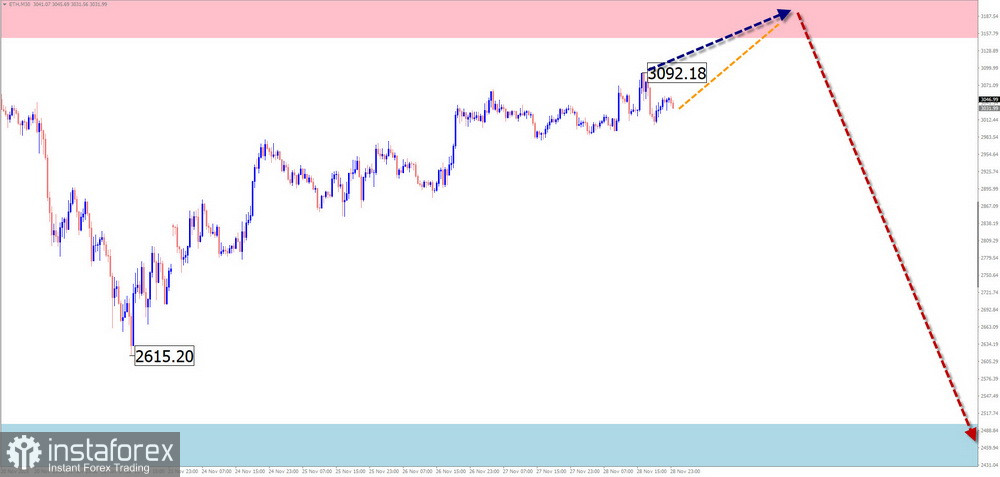
On the weekly Ethereum chart, a downward wave structure has been forming since mid-August of this year. The wave lacks its final section. Within the last part (C), an intermediate upward pullback is developing.
Forecast:
Over the coming week, Ethereum is expected to continue its overall sideways movement, mostly with an upward bias. A reversal is expected near the resistance zone. Increased volatility and an active phase of downward movement are likely beginning in December. The final target of the current upward movement is the calculated support zone.
Potential Reversal Zones
Resistance:
Support:
Recommendations:
Litecoin
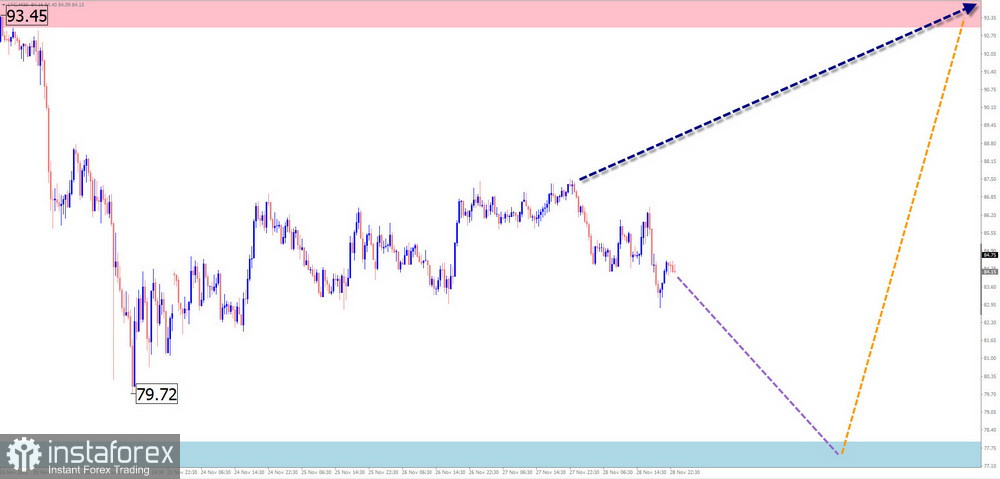
The latest unfinished Litecoin wave structure has a downward vector. In the larger weekly wave, this segment is at the end of a corrective flat. The price corridor created by the quotes has formed a "flag" price pattern. The wave structure shows no signs of completion.
Weekly Forecast:
Over the next few days, Litecoin is highly likely to continue moving downward until it reaches the support zone. Afterward, a sideways phase is possible, creating conditions for a reversal and a rise toward the resistance zone. The support zone lies at the lower border of the strong potential reversal area.
Potential Reversal Zones
Resistance:
Support:
Recommendations:
Ripple
Brief analysis:
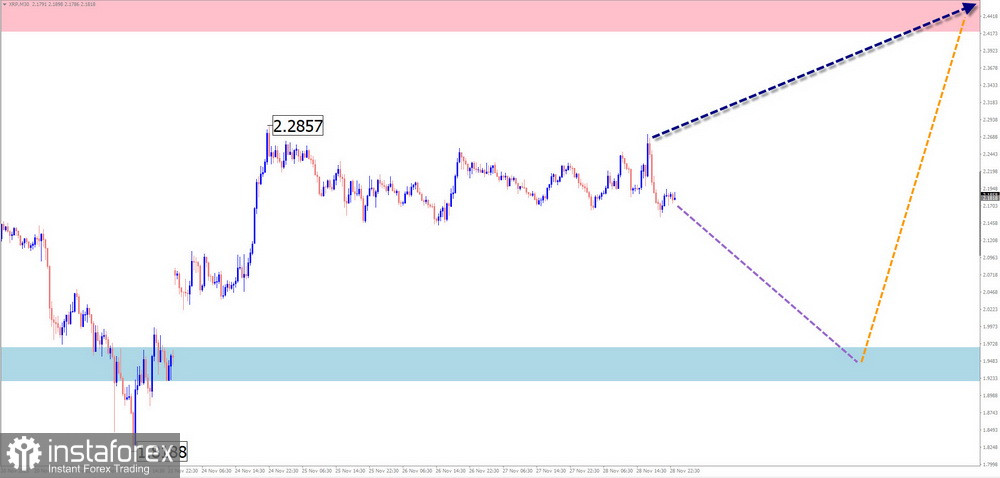
On the weekly Ripple chart, the downward wave that began in November of last year is nearing completion. In the larger wave model, this is a correction. From the upper boundary of a strong reversal zone, an upward corrective wave began a week ago.
Weekly Forecast:
In the coming days, Ripple's price is expected to move mostly sideways. A price pullback toward the support zone is possible. After that, a reversal and a renewed upward movement are likely. Increased activity is more probable toward the end of the week.
Potential Reversal Zones
Resistance:
Support:
Recommendations:
Notes: In Simplified Wave Analysis (SWA), all waves consist of 3 parts (A-B-C). On each timeframe, the last unfinished wave is analyzed. Dashed lines show expected movements.
Warning: The wave algorithm does not account for the duration of price movements over time!
*The market analysis posted here is meant to increase your awareness, but not to give instructions to make a trade.
InstaSpot analytical reviews will make you fully aware of market trends! Being an InstaSpot client, you are provided with a large number of free services for efficient trading.


