


Our team has over 7,000,000 traders!
Every day we work together to improve trading. We get high results and move forward.
Recognition by millions of traders all over the world is the best appreciation of our work! You made your choice and we will do everything it takes to meet your expectations!
We are a great team together!
InstaSpot. Proud to work for you!


Actor, UFC 6 tournament champion and a true hero!
The man who made himself. The man that goes our way.
The secret behind Taktarov's success is constant movement towards the goal.
Reveal all the sides of your talent!
Discover, try, fail - but never stop!
InstaSpot. Your success story starts here!

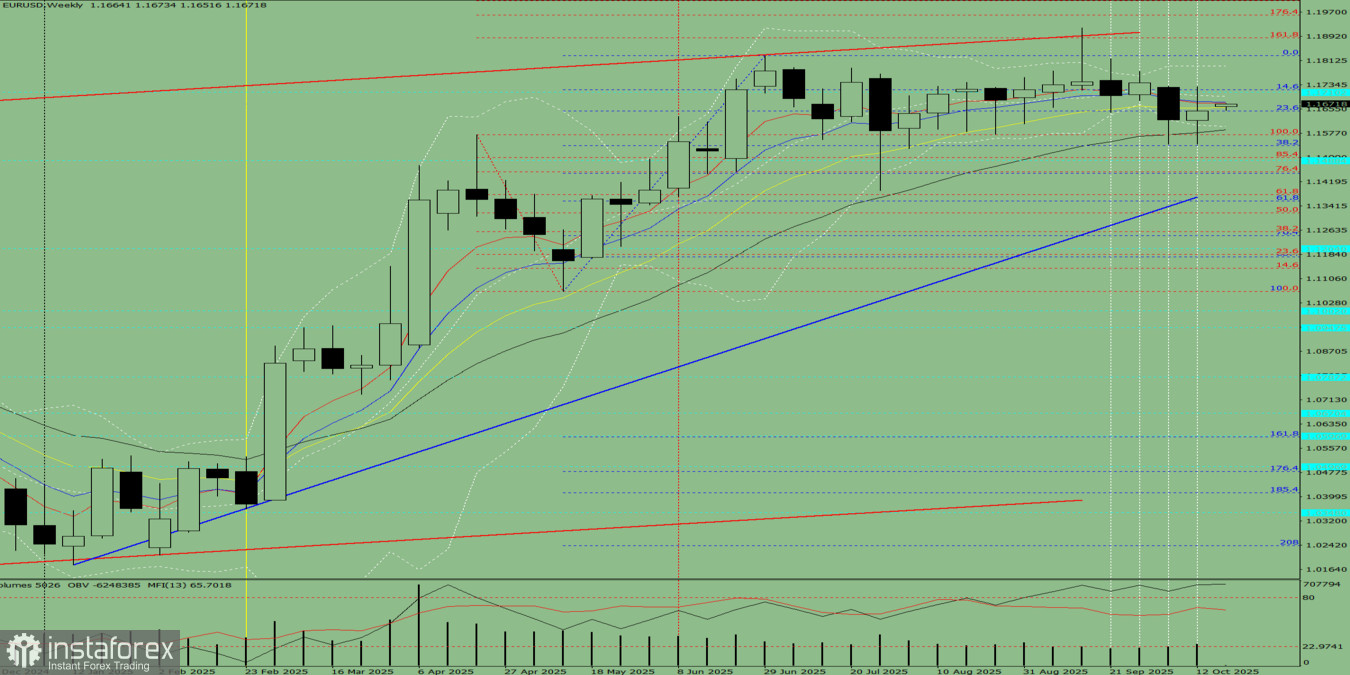
Fig. 1 (Weekly Chart)
Conclusion from comprehensive analysis: Downward movement.
Overall summary for the EUR/USD weekly candle calculation: During the week, the price is most likely to follow a downward trend, forming a black weekly candle with a first upper shadow (Monday — upward movement) and a second lower shadow (Friday — upward movement).
Alternative Scenario:
From the level of 1.1650 (the closing price of the last weekly candle), the pair may begin a downward movement toward 1.1447 — the 50% retracement level (blue dashed line). Upon testing this level, the price may start moving upward toward 1.1498 — the historical support level (blue dashed line).
*The market analysis posted here is meant to increase your awareness, but not to give instructions to make a trade.
InstaSpot analytical reviews will make you fully aware of market trends! Being an InstaSpot client, you are provided with a large number of free services for efficient trading.


