




The legend in the InstaSpot team!
Legend! You think that's bombastic rhetoric? But how should we call a man, who became the first Asian to win the junior world chess championship at 18 and who became the first Indian Grandmaster at 19? That was the start of a hard path to the World Champion title for Viswanathan Anand, the man who became a part of history of chess forever. Now one more legend in the InstaSpot team!





Borussia is one of the most titled football clubs in Germany, which has repeatedly proved to fans: the spirit of competition and leadership will certainly lead to success. Trade in the same way that sports professionals play the game: confidently and actively. Keep a "pass" from Borussia FC and be in the lead with InstaSpot!

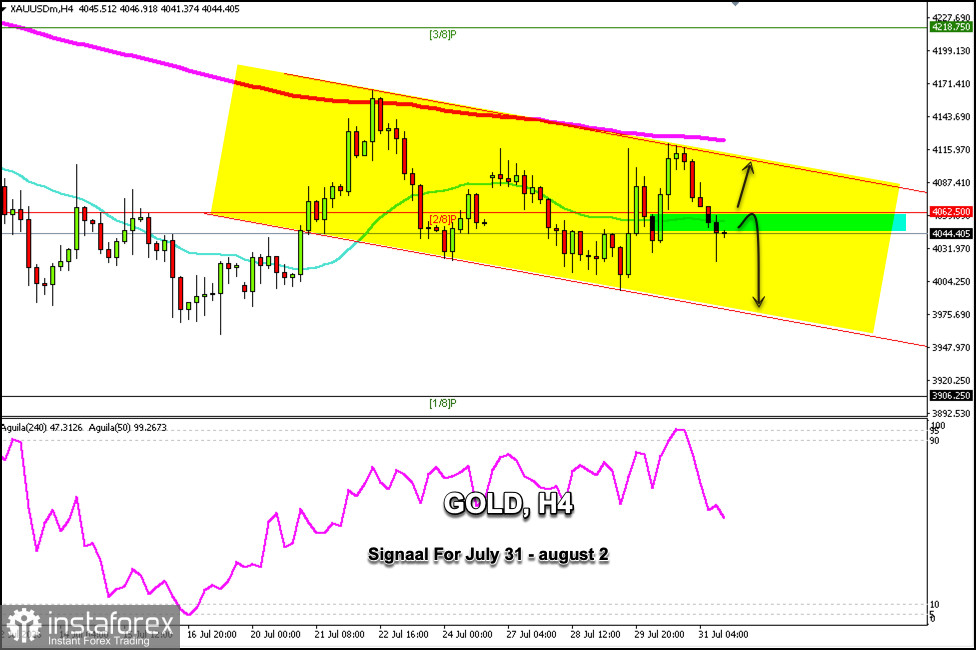
Gold is trading around $4,044, below the 2/8 Murray line and the 21-period simple moving average (SMA), showing a downtrend and trading within a bearish channel that has been forming since July 20.
On the H4 chart, we can see that gold, after hitting a low of $4,020, is rebounding and could continue to rise in the coming days. The Eagle indicator shows a negative signal, so if the price consolidates below the 2/8 Murray level, around $4,062, it could resume its downtrend.
Conversely, if gold trades above $4,062, the outlook could be positive, and the price could reach the upper band of the bullish channel, around $4,086.
Since gold is currently within a bearish channel, it is likely to encounter strong resistance around $4,115 or solid support around $3,980 in the coming days.
We should monitor the 2/8 Murray zone to take long or short positions, as this is a key level for gold.
*The market analysis posted here is meant to increase your awareness, but not to give instructions to make a trade.
InstaSpot analytical reviews will make you fully aware of market trends! Being an InstaSpot client, you are provided with a large number of free services for efficient trading.


