




Our team has over 7,000,000 traders!
Every day we work together to improve trading. We get high results and move forward.
Recognition by millions of traders all over the world is the best appreciation of our work! You made your choice and we will do everything it takes to meet your expectations!
We are a great team together!
InstaSpot. Proud to work for you!





Actor, UFC 6 tournament champion and a true hero!
The man who made himself. The man that goes our way.
The secret behind Taktarov's success is constant movement towards the goal.
Reveal all the sides of your talent!
Discover, try, fail - but never stop!
InstaSpot. Your success story starts here!

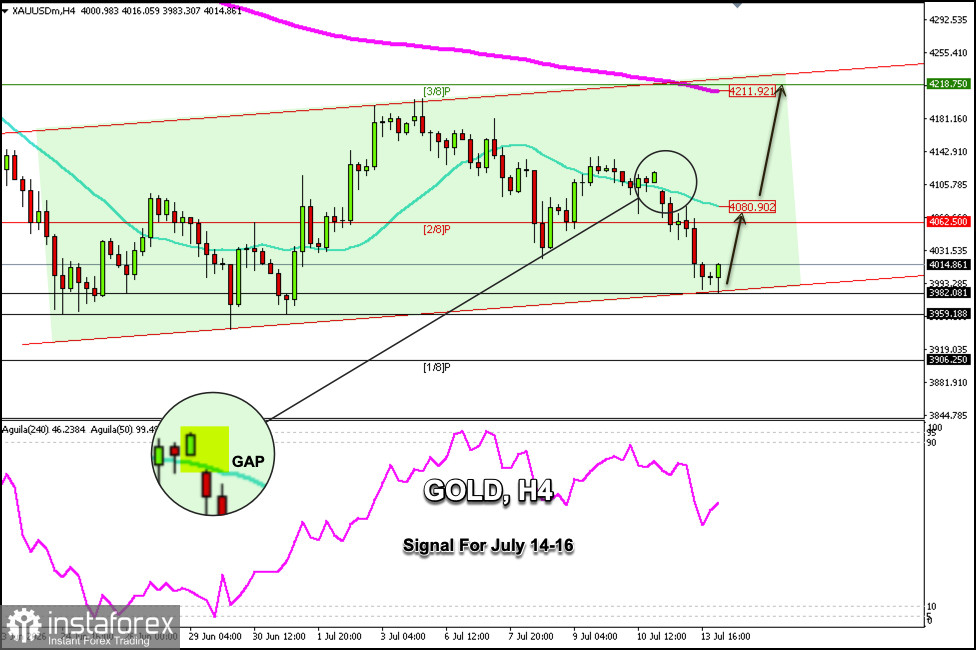
Gold is trading around $4,014, rebounding after hitting a low of $3,982 during Tuesday's Asian session. From a technical perspective, gold is expected to continue rising in the coming hours until it reaches the 2/8 Murray level, around $4,060.
If gold consolidates above the psychological $4,000 level, the outlook could be positive, and the metal could reach the 21-period simple moving average (SMA) around $4,080.
According to the H4 chart, we can see that gold left a gap around $4,124. If the price continues to rise above $4,000 - $4,060, it is likely to fill this gap and could reach the 200-period EMA, around $4,211.
On the H4 chart, we can see that gold has been trading within a bullish channel formed since June 24, suggesting that once it breaks above the psychological level of $4,000 in the coming days, it is likely to continue rising, which could be a clear buy signal.
A stop-loss could be placed below the low of June 30 or June 23, which is around $3,959, as this would indicate a break below the channel and could lead to a continued decline toward the 1/8 Murray level.
*The market analysis posted here is meant to increase your awareness, but not to give instructions to make a trade.
InstaSpot analytical reviews will make you fully aware of market trends! Being an InstaSpot client, you are provided with a large number of free services for efficient trading.


