


The legend in the InstaSpot team!
Legend! You think that's bombastic rhetoric? But how should we call a man, who became the first Asian to win the junior world chess championship at 18 and who became the first Indian Grandmaster at 19? That was the start of a hard path to the World Champion title for Viswanathan Anand, the man who became a part of history of chess forever. Now one more legend in the InstaSpot team!


Borussia is one of the most titled football clubs in Germany, which has repeatedly proved to fans: the spirit of competition and leadership will certainly lead to success. Trade in the same way that sports professionals play the game: confidently and actively. Keep a "pass" from Borussia FC and be in the lead with InstaSpot!

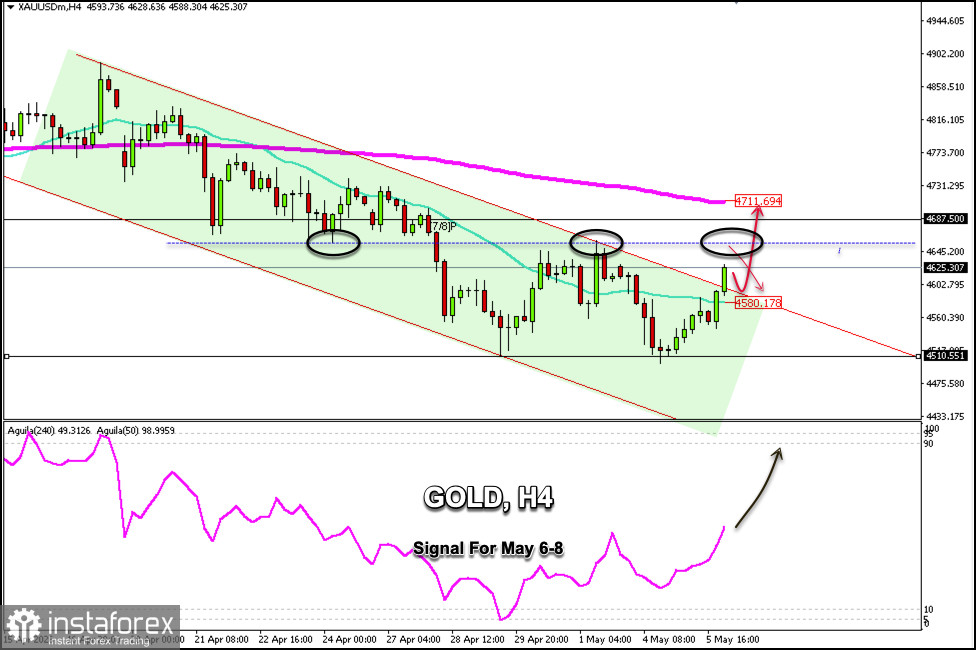
After forming a double bottom pattern around $4,510 and hitting a low of $4,501 during Monday's US trading session, gold is going on with its technical rebound. On the H4 chart, we now see a decisive break above the uptrend channel.
If the gold price consolidates above $4,600 in the coming days, this could be seen as a positive signal to buy, with targets at $4,687 and ultimately at the 200 EMA around $4,711.
According to the H4 chart, gold is breaking out of the bearish trend channel formed since April 16, and we could expect it to reach the daily R_2 around $4,650. After reaching this zone, we could see a technical correction toward the $4,580 area; or, above this zone, we could buy with targets at $4,687 and $4,700.
If the instrument returns and consolidates below the uptrend channel and below the 21 SMA around $4,580, the bearish cycle could resume, potentially reaching the key support at $4,510 and possibly even hitting the 6/8 Murray level at $4,375.
Given that gold has formed a double-bottom technical reversal pattern, it is expected to continue rising in the coming days and could reach the 200 EMA at $4,711 and even return to the April 16 price levels around $4,870.
*The market analysis posted here is meant to increase your awareness, but not to give instructions to make a trade.
InstaSpot analytical reviews will make you fully aware of market trends! Being an InstaSpot client, you are provided with a large number of free services for efficient trading.


