


Our team has over 7,000,000 traders!
Every day we work together to improve trading. We get high results and move forward.
Recognition by millions of traders all over the world is the best appreciation of our work! You made your choice and we will do everything it takes to meet your expectations!
We are a great team together!
InstaSpot. Proud to work for you!


Actor, UFC 6 tournament champion and a true hero!
The man who made himself. The man that goes our way.
The secret behind Taktarov's success is constant movement towards the goal.
Reveal all the sides of your talent!
Discover, try, fail - but never stop!
InstaSpot. Your success story starts here!

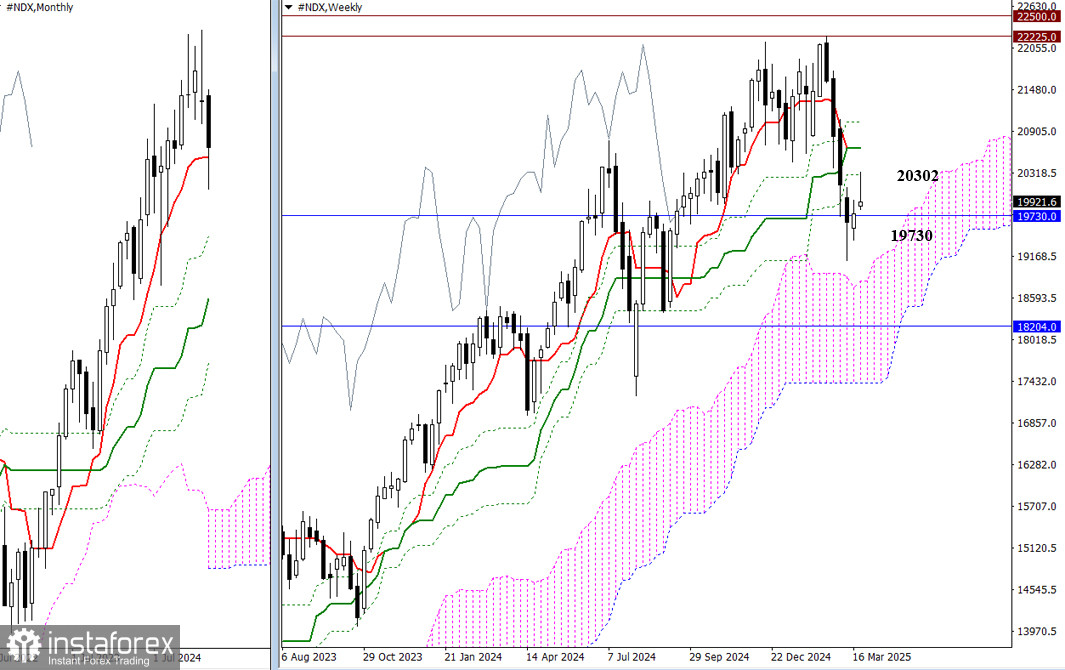
A stall at the monthly short-term trend level (19730) prompted an effort by bulls to reclaim their positions. As a result, a bullish gap formed at the start of the new trading week, with a test of the weekly resistance level at 20302. If this level is breached, the market will face two additional weekly resistance zones slightly above (20669 – 21036). However, if bulls lose momentum during a retest, the opposing side could swiftly return the market to the gravitational zone around the monthly Tenkan (19730), aiming to break the recent low (19113) and intensify bearish sentiment.
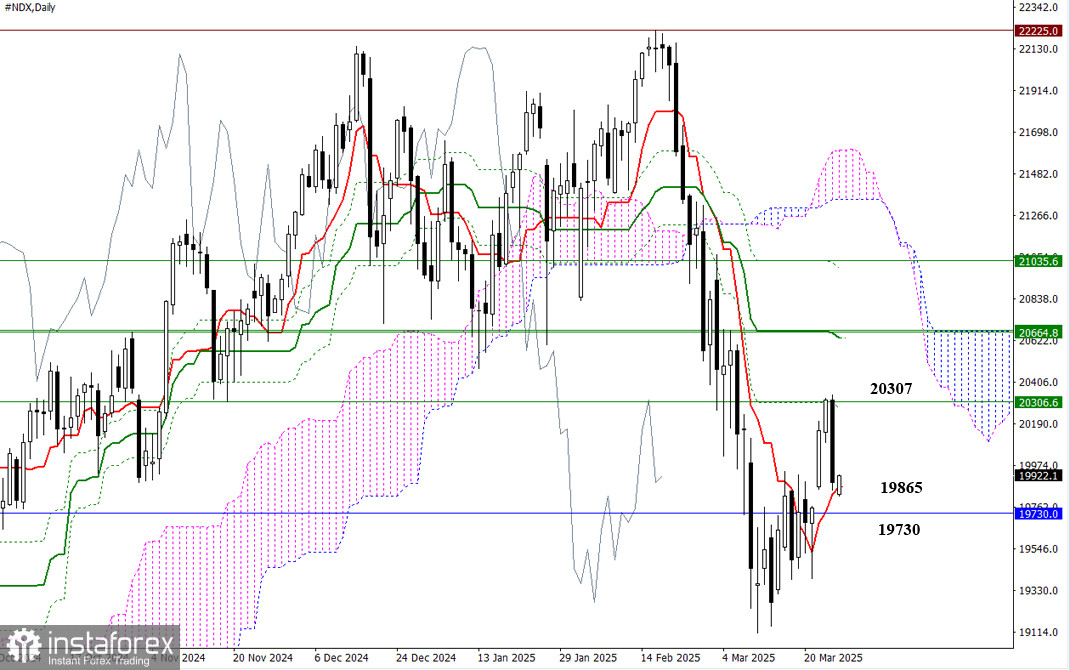
Yesterday's test of the Kijun Fibonacci levels (daily and weekly at 20302) resulted in a daily rebound. By the end of the session, the market had corrected downward to the daily short-term trend level (19865). The daily short-term trend supports (19865) and monthly supports (19730) will try to defend bullish interests. Failure to hold, breaking these supports, and moving out of the current attraction zone will shift market attention toward bearish targets—specifically, a new low at 19113 and a possible resumption of the broader downtrend.
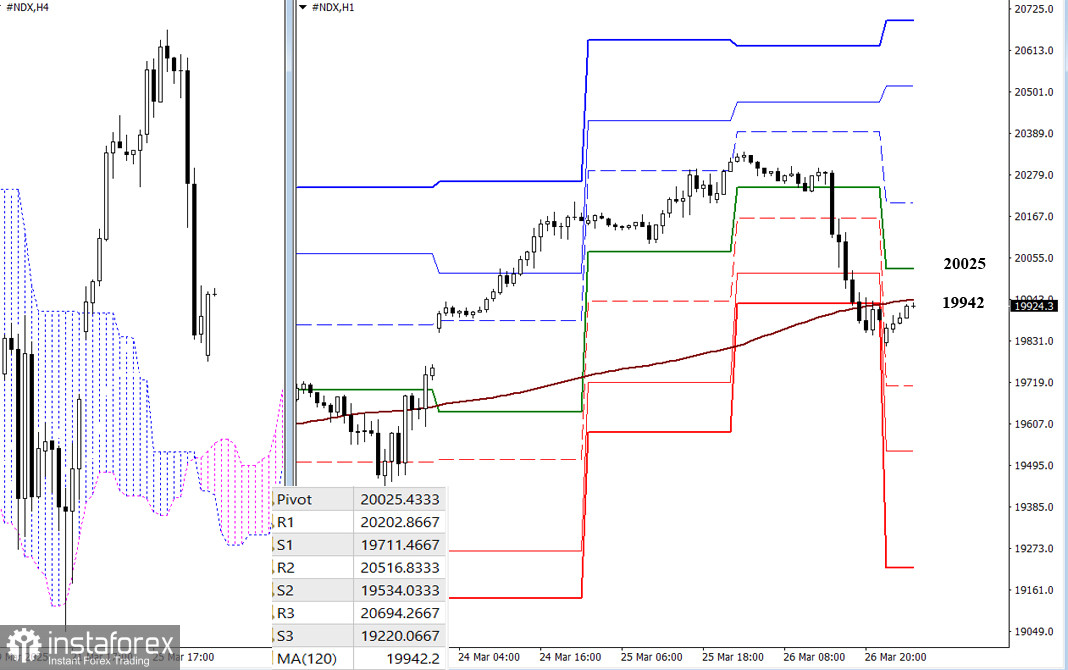
In the lower timeframes, the market now interacts with a key level determining the primary advantage: the weekly long-term trend in 19942. Whichever side holds this level will likely gain further momentum. Additional intraday bearish targets include the support levels of the classic Pivot Points (19712 – 19534 – 19220). Resistance levels at the classic Pivot Points (20025 – 20203 – 20517 – 20694) may serve as useful guides for bulls aiming to recover.
***
*The market analysis posted here is meant to increase your awareness, but not to give instructions to make a trade.
InstaSpot analytical reviews will make you fully aware of market trends! Being an InstaSpot client, you are provided with a large number of free services for efficient trading.


