


Our team has over 7,000,000 traders!
Every day we work together to improve trading. We get high results and move forward.
Recognition by millions of traders all over the world is the best appreciation of our work! You made your choice and we will do everything it takes to meet your expectations!
We are a great team together!
InstaSpot. Proud to work for you!


Actor, UFC 6 tournament champion and a true hero!
The man who made himself. The man that goes our way.
The secret behind Taktarov's success is constant movement towards the goal.
Reveal all the sides of your talent!
Discover, try, fail - but never stop!
InstaSpot. Your success story starts here!

To open long positions on EUR/USD:
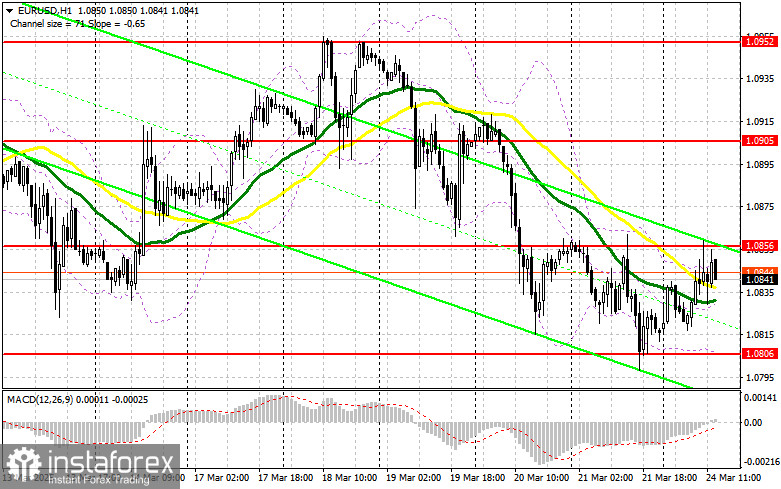
Rather lackluster PMI activity data from the eurozone prevented the euro from continuing its rise against the dollar. In the second half of the day, we await US data on the manufacturing PMI, the services PMI, and the composite PMI. Speeches from FOMC members Raphael Bostic and Michael S. Barr are also expected, which may be interpreted in favor of dollar strength. In case of strong statistics and further correction in the pair, only a false breakout around the support at 1.0806 will serve as a signal for new EUR/USD purchases, aiming to build a bullish market with a target of retesting 1.0856. A breakout and retest of this range from top to bottom would confirm a correct entry point for long positions, targeting 1.0905. The furthest target will be the 1.0952 area, where I plan to take profit. If EUR/USD declines and there is no activity around 1.0806, which is more likely, the pair will likely continue correcting. In that case, sellers may push the price down to 1.0770. Only after forming a false breakout there will I consider buying the euro. I plan to open long positions on a rebound from 1.0743, targeting an intraday upward correction of 30–35 points.
To open short positions on EUR/USD:
Sellers showed themselves, and in case of a negative market reaction to Fed officials' statements, only a false breakout near 1.0856—similar to the scenario discussed above—will allow for short positions to be opened with a target at the 1.0806 support area. A breakout and consolidation below this range would offer another opportunity for selling, with a move toward 1.0770, which on its own would represent a significant correction. The furthest target will be the 1.0743 area, where I plan to take profit. If EUR/USD moves higher in the second half of the day and bears remain inactive around 1.0856, buyers may trigger a new upward move. In this case, I will postpone short positions until the pair tests the next resistance at 1.0905. I will sell there only after an unsuccessful breakout. If there is no downward movement at that level either, I will consider opening short positions on a rebound from 1.0952, targeting a downward correction of 30–35 points.
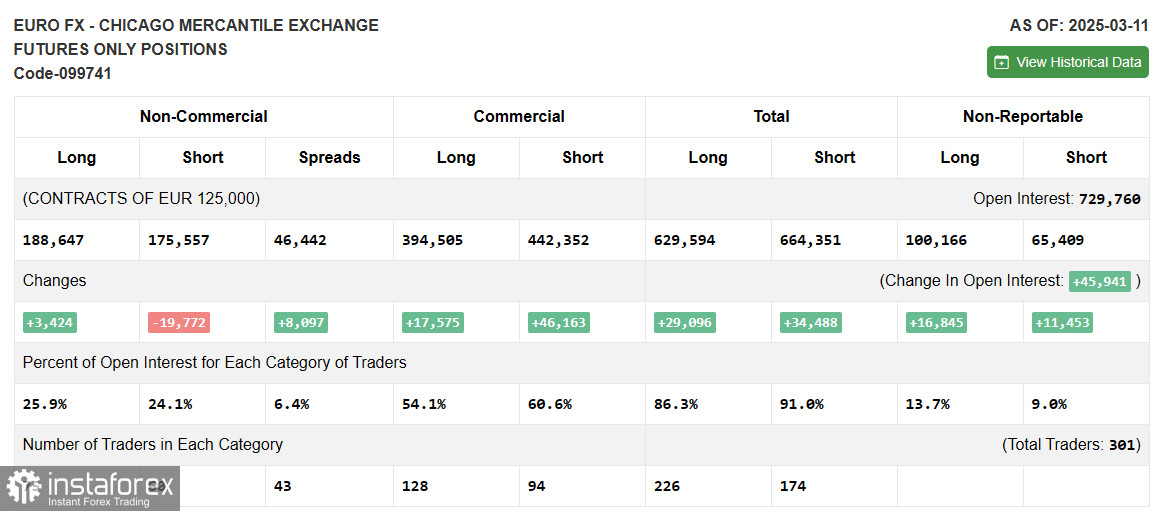
COT Report (Commitment of Traders) for March 11:
There was an increase in long positions and a notable reduction in shorts. Interest in buying the euro continues to grow, while sellers are rapidly exiting the market. Germany's fiscal stimulus policy and its strong support from the ECB are boosting demand for the euro. Additionally, progress in resolving the conflict in Ukraine supports the single currency. The upcoming Fed meeting may weaken the dollar even further if the regulator adopts a more dovish stance than expected. The COT report showed that long non-commercial positions rose by 3,424 to 188,647, while short positions dropped by 19,772 to 175,557. As a result, the gap between long and short positions widened by 8,097 in favor of the bulls.
Indicator Signals:
Moving Averages
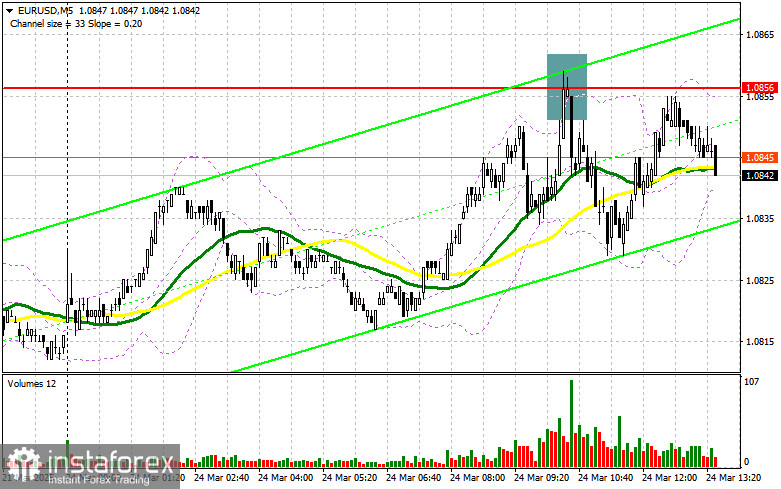
Trading is taking place around the 30- and 50-period moving averages, which indicates a sideways market.
Note: The author considers the moving averages on the H1 chart, which differ from the classic daily moving averages on the D1 chart.
Bollinger Bands
In the event of a decline, the lower boundary of the indicator around 1.0849 will serve as support.
Indicator Descriptions:
• Moving Average (used to identify the current trend by smoothing out volatility and noise). Period – 50, marked in yellow on the chart; • Moving Average. Period – 30, marked in green on the chart; • MACD Indicator (Moving Average Convergence/Divergence). Fast EMA – period 12, Slow EMA – period 26, SMA – period 9; • Bollinger Bands. Period – 20; • Non-commercial traders – speculators such as individual traders, hedge funds, and large institutions that use the futures market for speculative purposes and meet certain requirements; • Long non-commercial positions represent the total long open position of non-commercial traders; • Short non-commercial positions represent the total short open position of non-commercial traders; • The total non-commercial net position is the difference between short and long positions held by non-commercial traders.
*The market analysis posted here is meant to increase your awareness, but not to give instructions to make a trade.
InstaSpot analytical reviews will make you fully aware of market trends! Being an InstaSpot client, you are provided with a large number of free services for efficient trading.


